Ocean Carbon
Moderating the pace of a quickly warming planet
About half of human emissions are absorbed and stored in the ocean and on land, our planet's natural carbon sinks. What's left lingers in the air trapping heat and warming the planet to a current 1.3° above the pre-industrial era.
As more CO2 from human emissions accumulates in our atmosphere, Earth is being pushed beyond the stable conditions that have allowed the climate to stay in balance and life to thrive.
 +1.3 °C
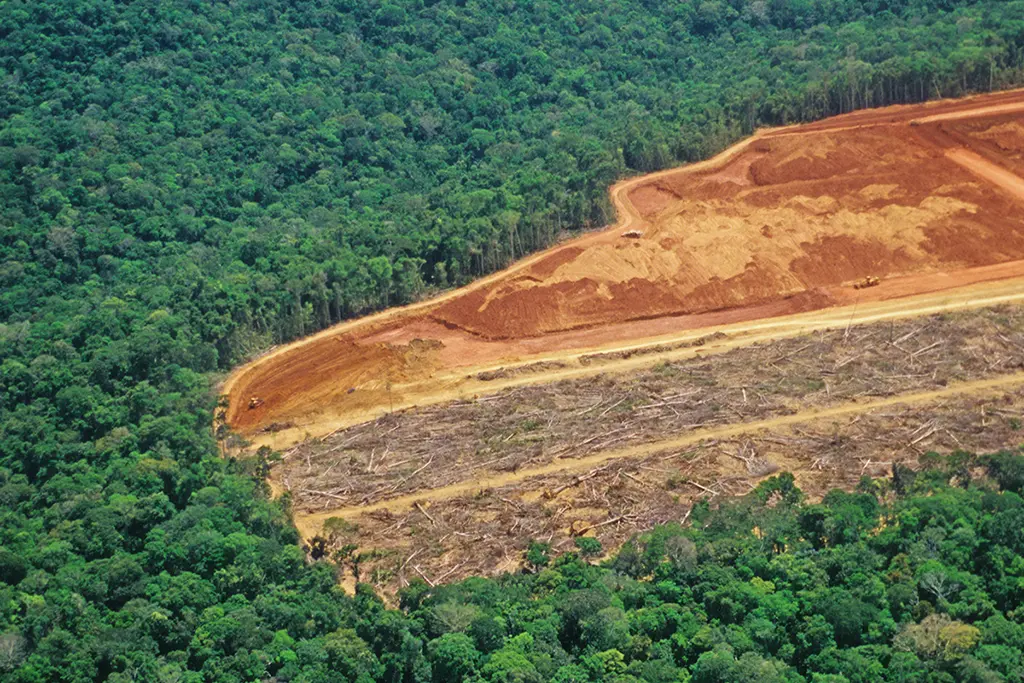
To track how the planet is warming and how Earth's systems are responding, each year The Global Carbon Budget makes an account of the planet's carbon balance: what we emit, what nature absorbs, and what remains in the atmosphere.

Only two of the components in the carbon budget can be measured directly to improve accuracy in these estimates. These two components are the carbon stored in the ocean, and the CO2 contained in the air. In the air CO2 is well mixed, spreading relatively quickly and evenly throughout, so only a few measurement stations across the world are needed. But, ocean carbon concentrations are much more variable and harder to measure.

After decades of ocean research, Earth Observation science is revealing the full picture of the ocean's carbon - how much is absorbed, where it is stored or exhaled, and how this is changing over time.

The ocean carbon sink is a forced system,
says Jamie Shutler, a professor of Earth Observation and Climate at the University of Exeter and the scientific lead of the European Space Agency's (ESA) Ocean Carbon for Climate.
The Earth system is always trying to equalise the gas concentrations. If more carbon is added to the atmosphere, this forces the ocean to try to absorb it to balance the concentration across the atmosphere and water interface.
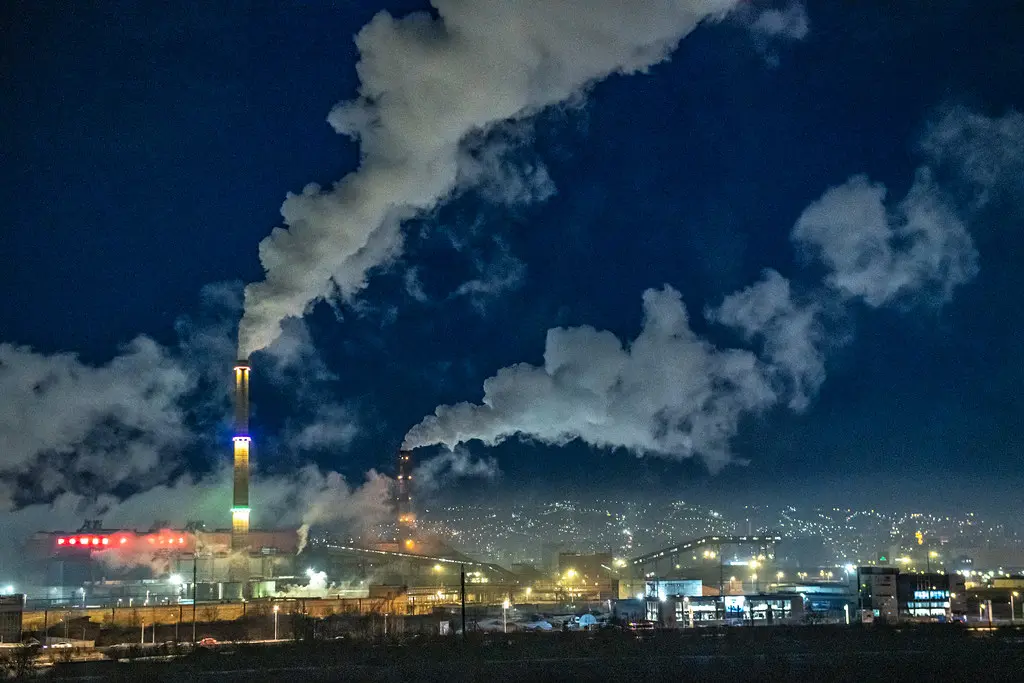
For millions of years, the ocean exhaled more CO2 than it absorbed because far more carbon was stored in its waters than in the atmosphere above. But, as countries industrialised, starting with the development of steam engines, this balance shifted. The widespread burning of fossil fuels caused atmospheric carbon levels to rise beyond what was naturally held in the ocean.

As a result, the ocean began absorbing more CO2 than it exhaled. Human activity has converted the entire ocean from a natural net carbon source to our planet's largest carbon sink.
The ocean carbon sink increases in response to the increase of carbon in the atmosphere.
If you take the global ocean as a whole,
says Prof. Shutler, the carbon uptake rate is generally in line with increasing emissions, but regionally that is not the case: some areas are taking up more than others.
Scientists use satellite records of sea temperature, salinity, ocean colour, ice and atmospheric data, in combination with in-situ biogeochemical data, to monitor both the long term ocean carbon sink and the CO2 that the ocean exhales, or exchanges with the atmosphere, called the ocean carbon flux.
Satellite-derived data of average changes in the ocean carbon sink and flux
Explore in the map long term satellite and in situ measurements of carbon sink and carbon flux from 1985-2018.
Explore
The ocean carbon flux is the dynamic exchange of gas between the atmosphere and the ocean. Warmer water has less capacity to hold CO2 so the gas rises to the surface and can be exhaled. On the map, red areas show where the ocean emits more CO2 than it absorbs over time, while blue areas point to net ocean carbon sinks. White indicates no net carbon exchange. Source: UExP-FNN-U full surface ocean carbonate system from OC4C.2

Satellites have monitored the ocean for over four decades. Since 2008, ESA's Climate Change Initiative (CCI) has combined data from successive missions to create the long-term records needed to track ocean change, something no single satellite can do alone.
OC4C and its partner project, SCOPE (Satellite-based Observations of Carbon in the Ocean: Pools, Fluxes, and Exchanges), use this CCI data to produce research that feeds into major climate assessments, from the Global Carbon Budget and the Potsdam Institute's Planetary Health Checks, to the Intergovernmental Panel on Climate Change reports that shape global climate policy.
An Invisible Forest
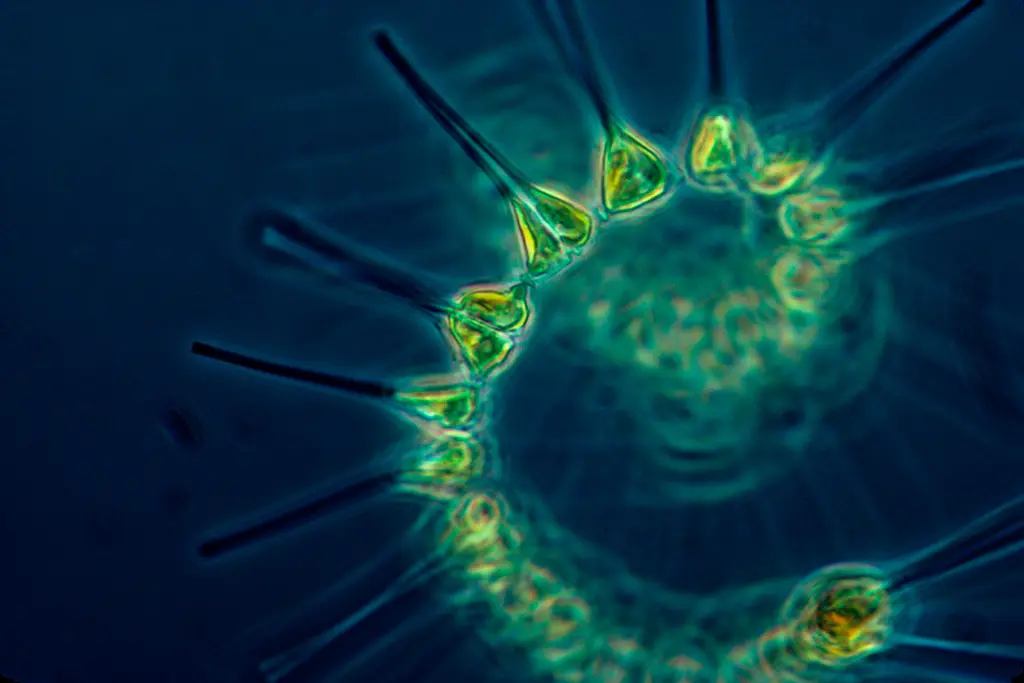
Beyond capturing the interactions between the ocean and the atmosphere, satellites are also looking at life beneath the waves, where microscopic organisms play a central role in Earth's carbon cycling system. Near the ocean surface, algae known as phytoplankton use sunlight, heat, and nutrients to transform CO2 in the water into living biomass, releasing oxygen in the process—the same photosynthesising trick that plants use on land. Phytoplankton make up less than 1% of the planet’s photosynthetic biomass, yet they transform about the same amount of carbon as all terrestrial plants combined.3 The growth of phytoplankton is known as primary production and it forms the foundation of ocean life, providing sustenance for animals large and small, from zooplankton to whales.
Earth's carbon cycling system transports and stores carbon in the ocean in both organic (living) and inorganic (non-living) forms. When carbon is transported from one type of storage-or “pool”-to another, it is said to be “in flux.” Both the amount of carbon on the move and the size of the storage pools change over time.
ESA's SCOPE project builds on decades of research to capture the intimate links between ocean biology and ocean physics in order to better understand and measure ocean carbon.
Dr. Gemma Kulk is a Senior Earth Observation Scientist at Plymouth Marine Laboratory and science lead of SCOPE. As a biologist she is fascinated by the superpowers of the invisible phytoplankton life she studies.
You can't see them.
She states, but if you swim in the sea you are surrounded by millions of cells, it's like you are swimming in an ocean forest, and nobody realises it.
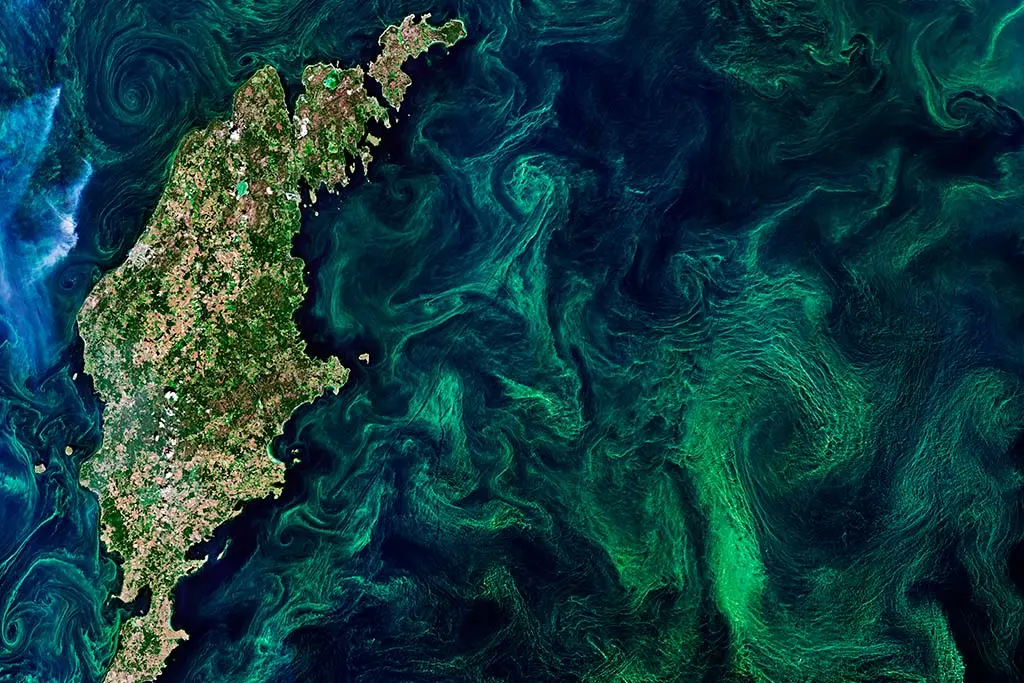
Phytoplankton are so small, they're hard to find, even when they're right in front of you, but ocean colour satellites can see them by looking for their chlorophyll-a pigment across large areas of ocean. Since the late 1970s, optical sensors onboard satellites have had the capacity to capture images of phytoplankton and ESA's ocean colour CCI project has combined the data from all of these satellites into long time series to study them.
Scientists agree that the ocean carbon cycle is changing,
says Kulk, but with climate change accelerating and so many interconnected processes at play, we're seeing multiple changes happening at once, and as a scientific community we need to work together to fully understand exactly what changes are happening and where.
In some regions of the ocean scientists are seeing a decline in carbon absorption, whereas in others, absorption is massively increasing. What's more, says Kulk, it seems that primary production has been increasing in recent years, whereas for the 20 years prior, when we started to observe ocean colour globally, we saw a slow decrease.
Lighter colours show increasing trends of phytoplankton, while darker colours represent decreasing trends. ESA's Ocean Colour CCI data can be accessed in the ESA CCI Open Data Portal and can be explored visually in the Copernicus My Ocean Viewer.

The west coast of South America is a powerful upwelling area where winds and currents pull cold water rich in CO2 and nutrients to the surface, feeding phytoplankton. Primary production is increasing in some of these areas.
Some of the ocean's least productive regions, often called ocean deserts, are growing larger. As climate change warms the ocean's surface, the growing temperature difference between surface and deep waters reduces mixing and limits the supply of already scarce nutrients to the surface.
Satellite data is still somewhat limited in polar regions such as Antarctica, indicated by the black areas without data around the white continent. But changes can still be seen, especially where glaciers have receded. Positive chlorophyll-a trends vary from 5% to over 25% per year over the past quarter century.
The polar regions are one area where climate driven changes are happening fastest and these are also hardest to monitor because of their inaccessibility, comments Kulk. With sea ice retreating due to climate change, summer sunlight reaches the ocean surface in polar regions and large expanses of phytoplankton, called blooms, can quickly grow in these nutrient rich waters. Satellites are key to monitoring these regions.
In the dark polar winter, satellites can't observe chlorophyll-a, the visible indicator of phytoplankton in the water. As part of the SCOPE project, scientists used data from robotic Argo floats dispersed in the North and South Polar Oceans alongside the last satellite observations from autumn and the first observations from spring. Piecing these different observed data together revealed the large seasonal changes in chlorophyll-a in the polar waters, and also how the winter decline in phytoplankton happens much faster in northern waters than it does in the southern waters.4 The study produced a 25-year record of ocean chlorophyll-a that can now be used in climate research, machine learning, and other applications that require global data across all seasons. It's one more important piece in place to help improve and tune the global carbon budget.
Ocean acidification crosses a planetary boundary
As Earth's systems respond to a changing climate, the ocean is paying the price of removing excess CO2 from the atmosphere.
The ocean has acted like a brake on climate change, but this service to us humans has come at a cost.
- Professor Jamie Shutler
The reason lies in the chemistry of seawater. When CO2 dissolves into the ocean, it breaks into different chemical forms and changes the chemical balance, and therefore the pH, of the ocean. As increased absorption of CO2 continues, the ocean's pH is lowered and the carbonate in the water is depleted - a phenomenon often called ocean acidification.
The effects ripple through marine ecosystems when corals and shellfish are unable to find enough carbonate to build healthy skeletons. Some types of phytoplankton are being harmed as well, disrupting food sources for everything from small fish to the largest whales. The long-term loss of carbonate ions is also reducing the ocean's ability to absorb future CO2.
This is why, with every excess molecule of CO2 absorbed, the ocean's capacity to support life and to help slow climate change is diminished.
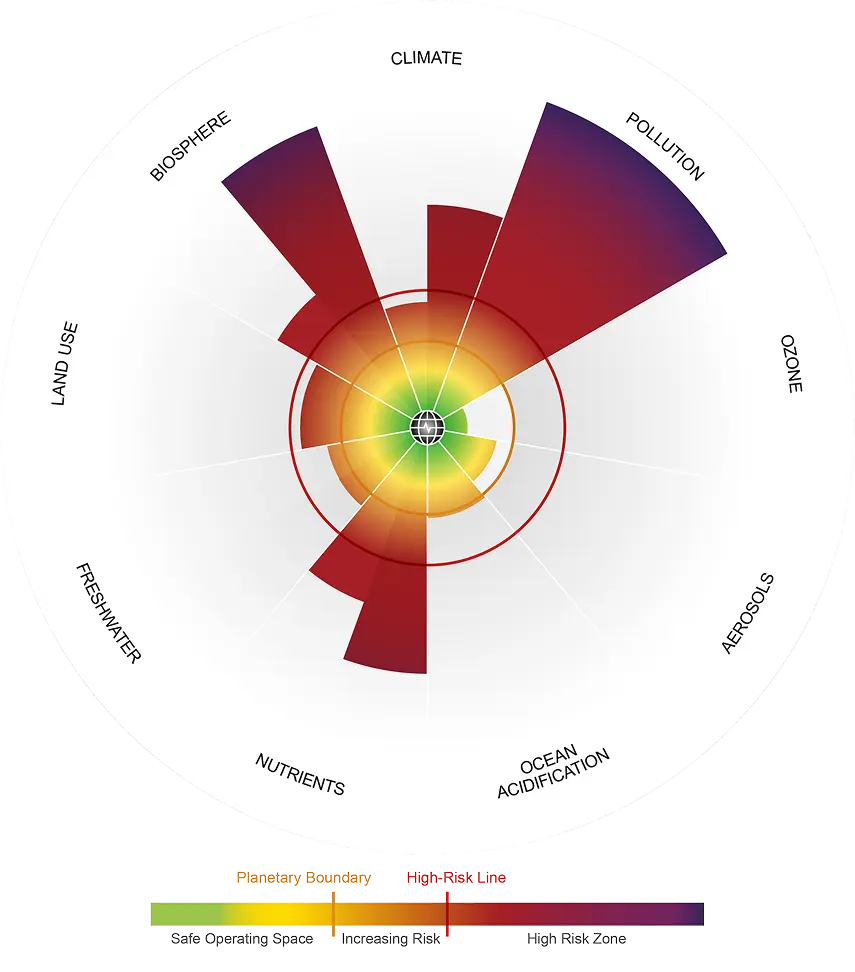
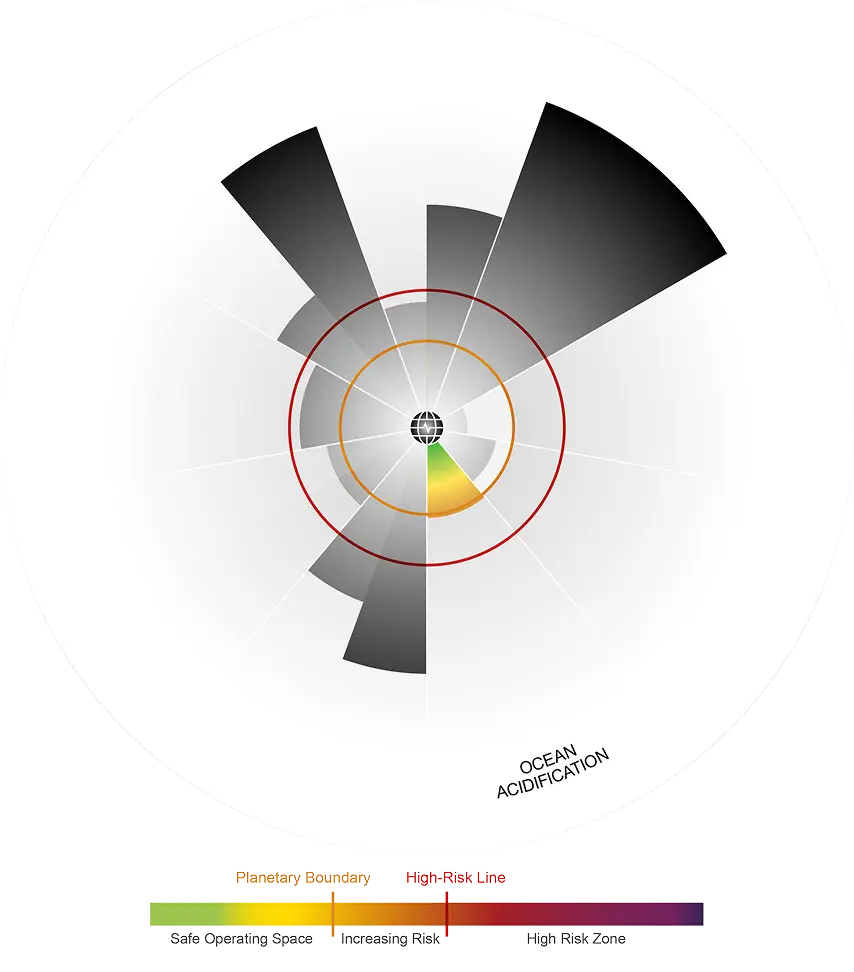
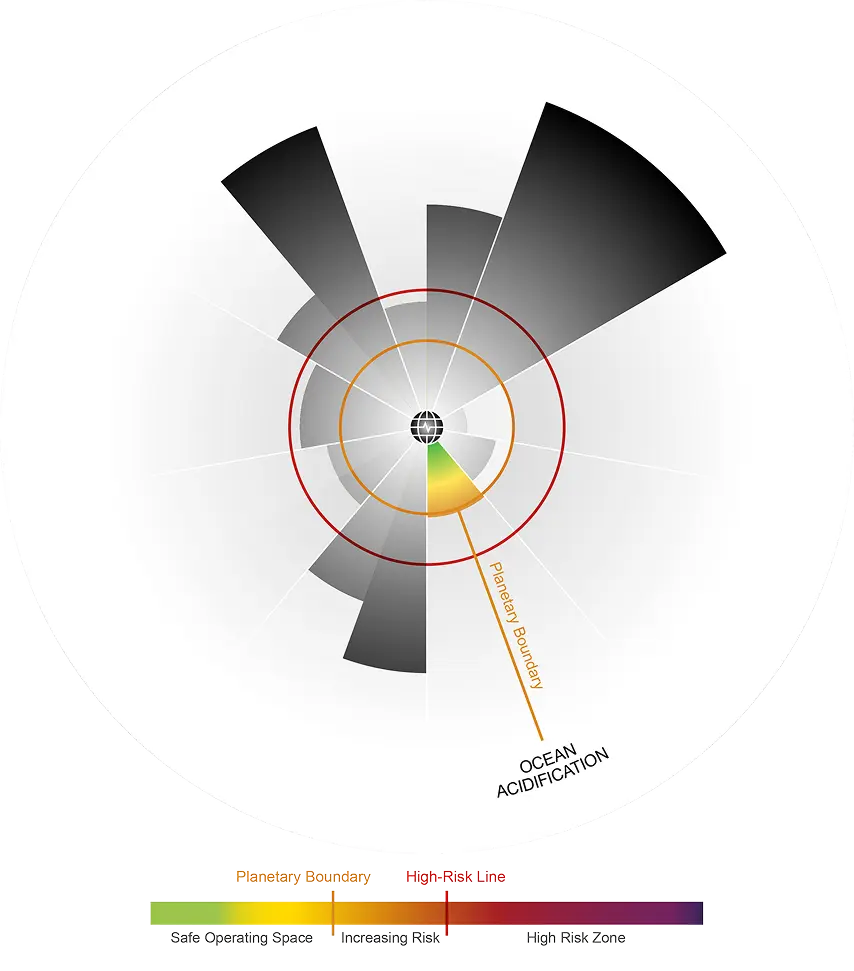
Ocean acidification is one of the nine “planetary boundaries” that define our planet's safe operating limits. Just as a doctor monitors a patient's vital signs to gauge wellbeing, scientists track these boundaries to measure the health of the Earth systems that support life in the annual Planetary Health Checkup. In the most recent 2025 check up, OC4C and SCOPE research provided evidence for the sobering news that the safe limit related to ocean acidification had been crossed, unheeded in 2020.5
While ocean acidification touches every part of the global ocean, its impacts are far from uniform. A second independent study, Ocean Acidification: Another Planetary Boundary Crossed,6 supported in part by ESA's Ocean Health - Ocean Acidification project and by NOAA (the National Oceanic and Atmospheric Administration), found that 40% of the surface and 60% of subsurface waters have already moved beyond the safe operating space for ecosystems, placing vast areas at growing risk of ecological disruption.6
The collapse of these species sets off a domino effect, threatening the habitat and food sources of countless organisms that rely on them, and triggering migrations for animals in search of more hospitable waters. Such shifts are already underway and echo climate-driven migrations seen on land. Yet not all species can relocate; those unable to move or adapt may ultimately disappear as their environments become too difficult to survive in.
Ocean acidification is shrinking coral reef habitat
Suitable coral reef habitat was much larger in the pre-industrial period than today.6
By 2020, ocean acidification had reduced suitable habitat areas by 40%, threatening reefs and the ocean ecosystem.6
Carbon, the ocean, and life bound together
The 2025 Global Carbon Budget points to a one-in-two chance that, by 2030, global temperatures will consistently rise beyond +1.5ºC of warming. Every fractional increase beyond this level can set off cascading impacts, placing growing strain on natural systems and the living communities that depend on them.
The ocean sits at the center of Earth's carbon balance. Throughout history, the ocean has quietly cared for the planet, regulating the climate and supporting life. Today, science is gathering more evidence that reveals how interconnected we are to the health of the ocean. Just as humanity owes its past to the moderating influence of Earth's ocean, our shared future will be shaped by how thoughtfully we manage our impacts. It's time we care for the ocean with the understanding that ocean health is inseparable from our own.
About
The production of this interactive story has been possible thanks to the efforts of Lobelia with the support of the following ESA projects: Ocean Carbon for Climate (OC4C), the Satellite-based observations of Carbon in the Ocean: Pools, Fluxes and Exchanges (SCOPE) and the Ocean Health - Ocean Acidification project. This story has been prepared under ESA EO Science for Society funding in the context of the ESA project Edukeo.
The basemap is Lobelia Oceans Dark, which uses data by ©OpenStreetMap contributors.
References
- Friedlingstein et al. (2025) Global Carbon Budget. Earth System Science Data. https://doi.org/10.5194/essd-2025-659
- Ford, Daniel J, Kulk, Gemma, Andrew Watson, Sathyendranath, Shubha and Shutler, Jamie, D. (2025) UExP-FNN-U full surface ocean carbonate system. Zenodo. https://zenodo.org/records/15801067
- Falkowski, P. (2012) Ocean Science: The power of plankton. Nature 483, S17-S20. https://doi.org/10.1038/483S17a
- Ford, Daniel, Kulk, Gemma, Sathyendranath, Shubha and Shutler, Jamie D. (2026) Decadal and spatially complete global surface chlorophyll-a data record from satellite and BGC-Argo observations https://doi.org/10.5194/essd-2025-389
- Gregor, L., Gruber, N. (2021) OceanSODA-ETHZ: a global gridded data set of the surface ocean carbonate system for seasonal to decadal studies of ocean acidification. Earth Syst. Sci. Data 13, 777-808.
- Findlay, Helen, et al. (2025) Ocean Acidification: Another Planetary Boundary Crossed. Global Change Biology. https://doi.org/10.1111/gcb.70238
Images and Videos
- Emissions from coal-fired power plants contribute to air pollution in Ulaanbaatar, Mongolia. Ariel Javellana / ADB.
- Deforestation in the Amazon. luoman / Istock by Getty Images.
- Phytoplankton. Wirestock / Istock by Getty Images.
- Green swirling phytoplankton seen from space by the Copernicus Sentinel-2 satellite mission in 2019. Baltic Sea. European Space Agency.
- ESA's ocean colour CCI project data can be explored in the Copernicus My Ocean Viewer.
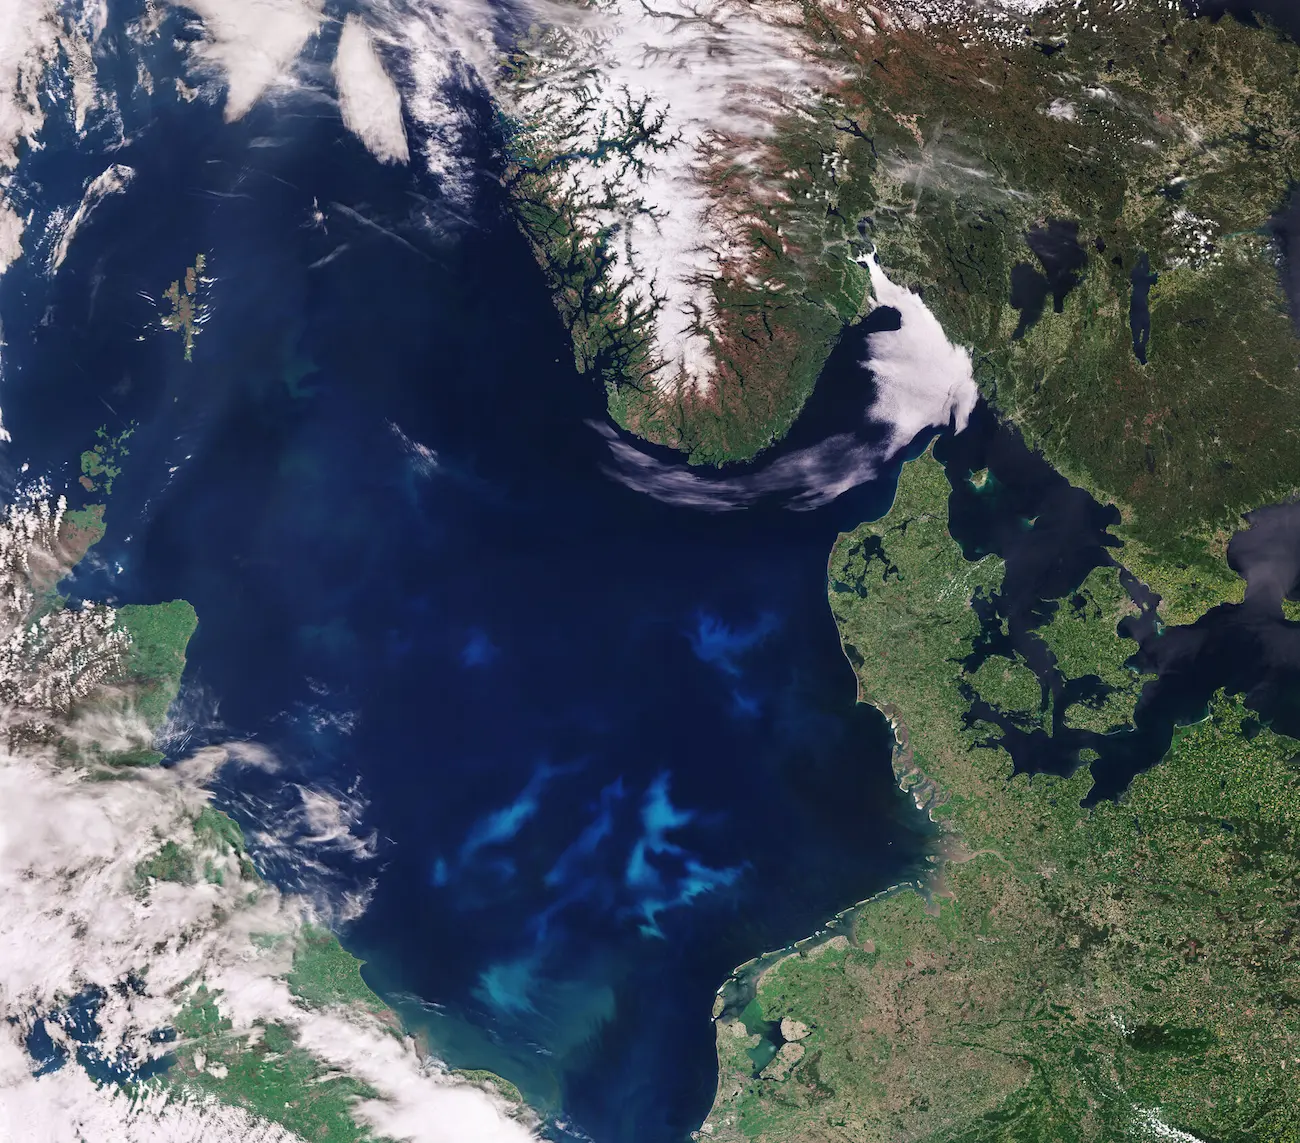
- North Sea bloom captured by Sentinel 3A. ESA images.
- Coral reef, Weh Island, Indonesia. Yen-Yi Lee / Ocean Image Bank.
- Dead corals. ARC Centre of Excellence for Coral Reef Studies / Flickr.
- Planetary Boundaries Framework. https://www.planetaryhealthcheck.org/
- Coral Reef at Palmyra Atoll National Wildlife Refuge, 2011. Jim Maragos / U.S. Fish and Wildlife Service.
- Coral reef in Sharm el Sheikh, Egypt. Renata Romeo / Ocean Image Bank.
- Humpback whale and calf, Tahiti, French Polynesia. Noemi Merz / Ocean Image Bank.
- Hawksbill Turtle Swimming on the Great Fringing Reef. Cinzia Osele Bismarck / Ocean Image Bank.