Into the water cycle
Understanding 21st century water challenges
Understanding 21st century
water challenges
Water is essential to all forms of life, sustaining both ecosystems and humans, and driving critical processes like agriculture, industry and energy production. It is an indispensable resource that touches every aspect of our existence.
On Earth, its circulation is driven by the water cycle—a dynamic process that continuously circulates water.
Climate change and the water cycle
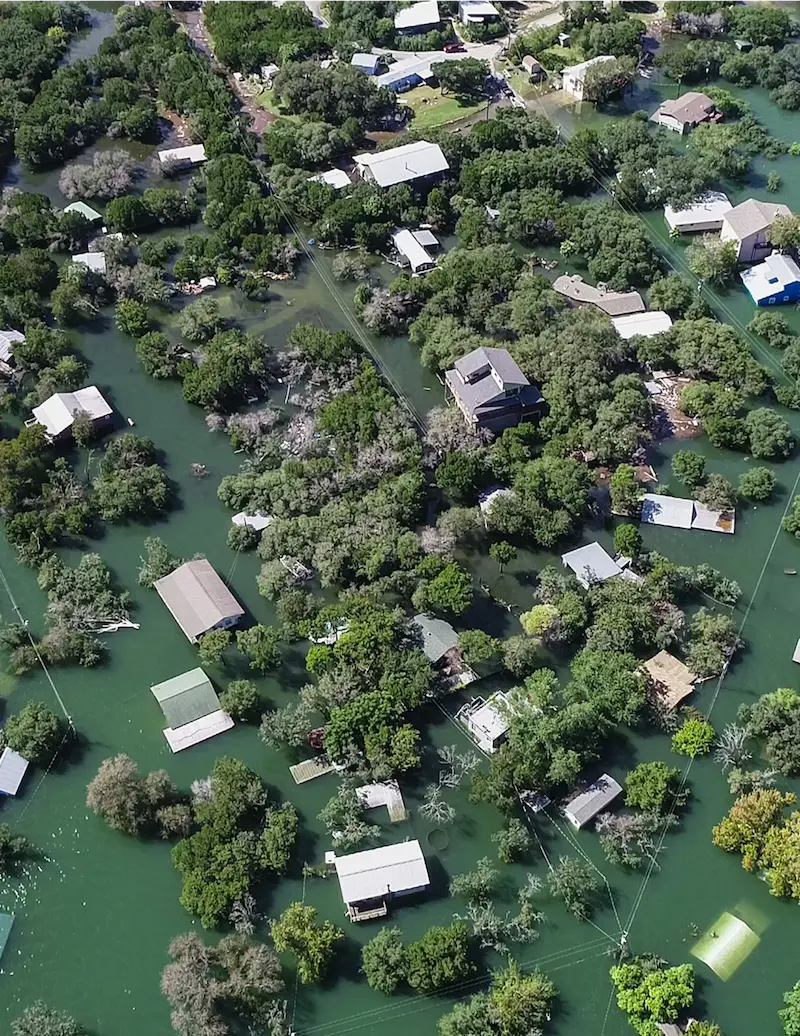
Climate change affects this cycle in many ways, reshaping water dynamics and availability. These changes are already visible today, with consequences that include more frequent and severe natural hazards. Between 1970 and 2019, 45% of climate-related disasters were floods. Moreover, in the same period, the total number of disasters has increased by a factor of five.1
Reported disasters 1970–2021
World Meteorological Organization. Status of Mortality and Economic Losses due to Weather, Climate and Water Extremes (1970–2021)
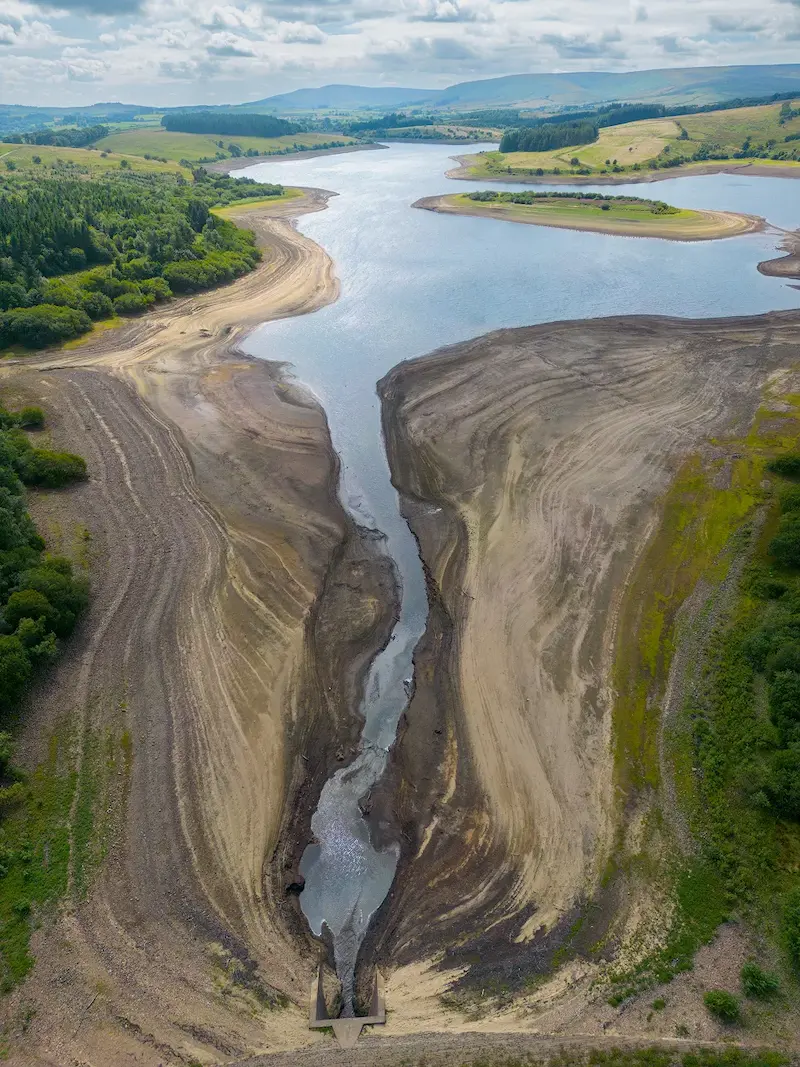
As climate change intensifies, droughts and floods are expected to become more frequent and severe.
Between 2000 and 2021, flood-related disasters have increased by
134%
in the meantime, the frequency of droughts grew by
29%
Responding to these events will remain challenging. Modelling tools offer simulations that can help strengthen our preparedness and resilience, helping to mitigate the most severe impacts.
One such tool is the European Space Agency’s Digital Twin Earth Hydrology project, a digital copy of the Earth surface mimicking the water cycle, and offering unprecedented resolution in both space and time. Its purpose is to improve our understanding of planetary processes, as well as to inform decision making —on a wide range of issues— from resource management and urban planning to disaster preparedness and climate change mitigation.
Using the Digital Twin Earth (DTE) Hydrology to better prepare for floods
The DTE Hydrology Platform provides detailed four-dimensional simulations of five key terrestrial water variables: soil moisture, precipitation, evaporation, snow depth, and river discharge. Combining satellite imagery with forecasts presented as graphs, DTE Hydrology offers high-resolution data freely accessible to public and private actors, enabling better preparation for extreme events by visualising potential scenarios.
The Mediterranean Basin, which is especially prone to floods and droughts and highly impacted by climate change, is a testbed to demonstrate the DTE Hydrology application. Particularly, the Po River Valley in Northern Italy served as a case study for modelling local flood risks under extreme conditions. For instance, during the November 2018 floods along the Po River, when torrential rain and strong winds claimed more than 30 lives and produced extensive property damage.
The DTE Hydrology “What if” scenario simulation shown below provides river discharge by incorporating precipitation and soil moisture conditions at the time of the event.2 For this flood, the predicted peak discharge of 5000 to 7000 m³/s closely corresponded to the observed peak of 5900 m³/s recorded in Pontelagoscuro station, demonstrating the tool’s accuracy in anticipating extreme river discharge.
Explore
In the scenario shown, we can observe the forecasted amount of river water discharge at each station (50th percentile) together with its upper and lower uncertainty.
Explore data from other stations in the Po Basin by clicking on the map markers.
DTE Hydrology Platform. River Po basin “What if” scenario simulation for 2018.
Explore
Explore data from other stations in the Po Basin by clicking on the map markers.
In the scenario shown, we can observe the forecasted amount of river water discharge at each station (50th percentile) together with its upper and lower uncertainty.


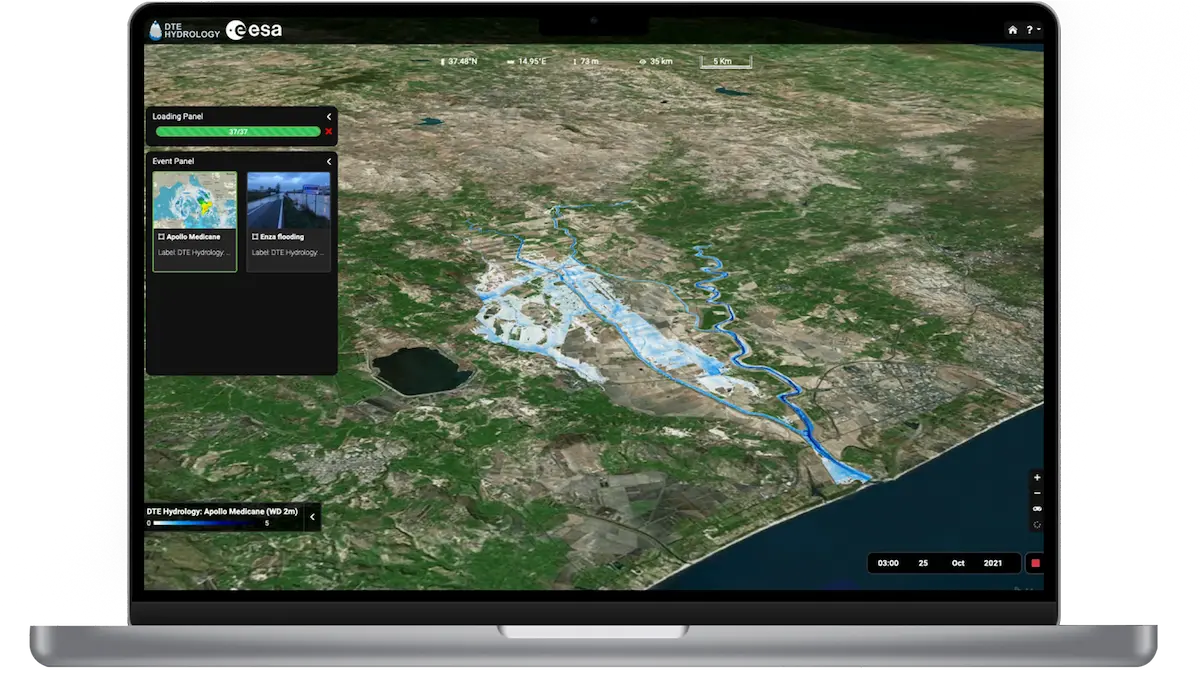
DTE Hydrology also models flooding scenarios, as illustrated below for the Apollo cyclone event in East Sicily in October 2021.2 These simulations identify the areas most likely to flood first when a river overflows, based on local topography. This valuable information enables local authorities to enhance early warning systems and optimise emergency response strategies.
What if we could also simulate droughts and anticipate them?
The promise of such foresight lies again in tools like DTE Hydrology, which could reshape how we face a warming, water-stressed world.
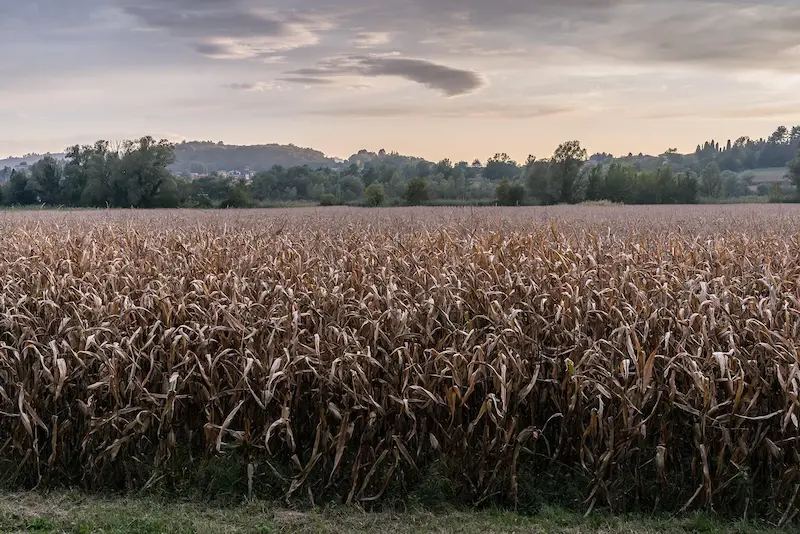
Unlike floods or storms, which occur more suddenly, droughts have a slow onset that often leads to an underestimation of their severity. However, the impact can be just as devastating, causing significant harm to agriculture, industry, and infrastructure.
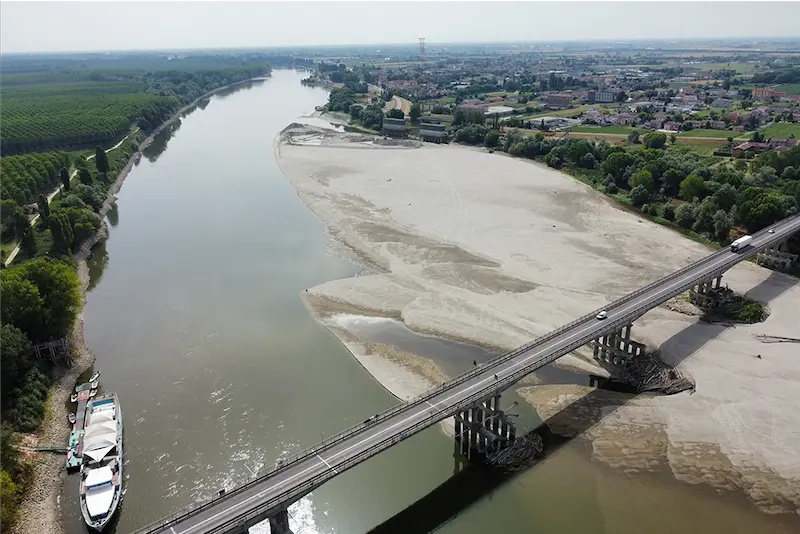
For example, Europe experienced an extreme drought in 2022. In Italy, the drought in the Po region was the most intense in 200 years,3 causing the Po River to shrink drastically and leaving much of its riverbed exposed. The consequences were staggering, yet the warning signs had been apparent for some time.
The drought began quietly in January and extended into a spring with no rainfall. By midsummer, the Italian government declared a state of emergency in five northern regions and allocated €37.5 million for relief efforts.4 Yet, the crisis outpaced these measures. Citizen water use was restricted in some cities, and some villages relied on tanker trucks for drinking water; power plants had to close for lack of cooling reserves; and the reverse current from the sea at the river’s mouth contaminated freshwater supplies.
In Italy, losses like these are projected to reach 600 million euros per year by the end of the century if no adaptation measures are taken.5
Explore
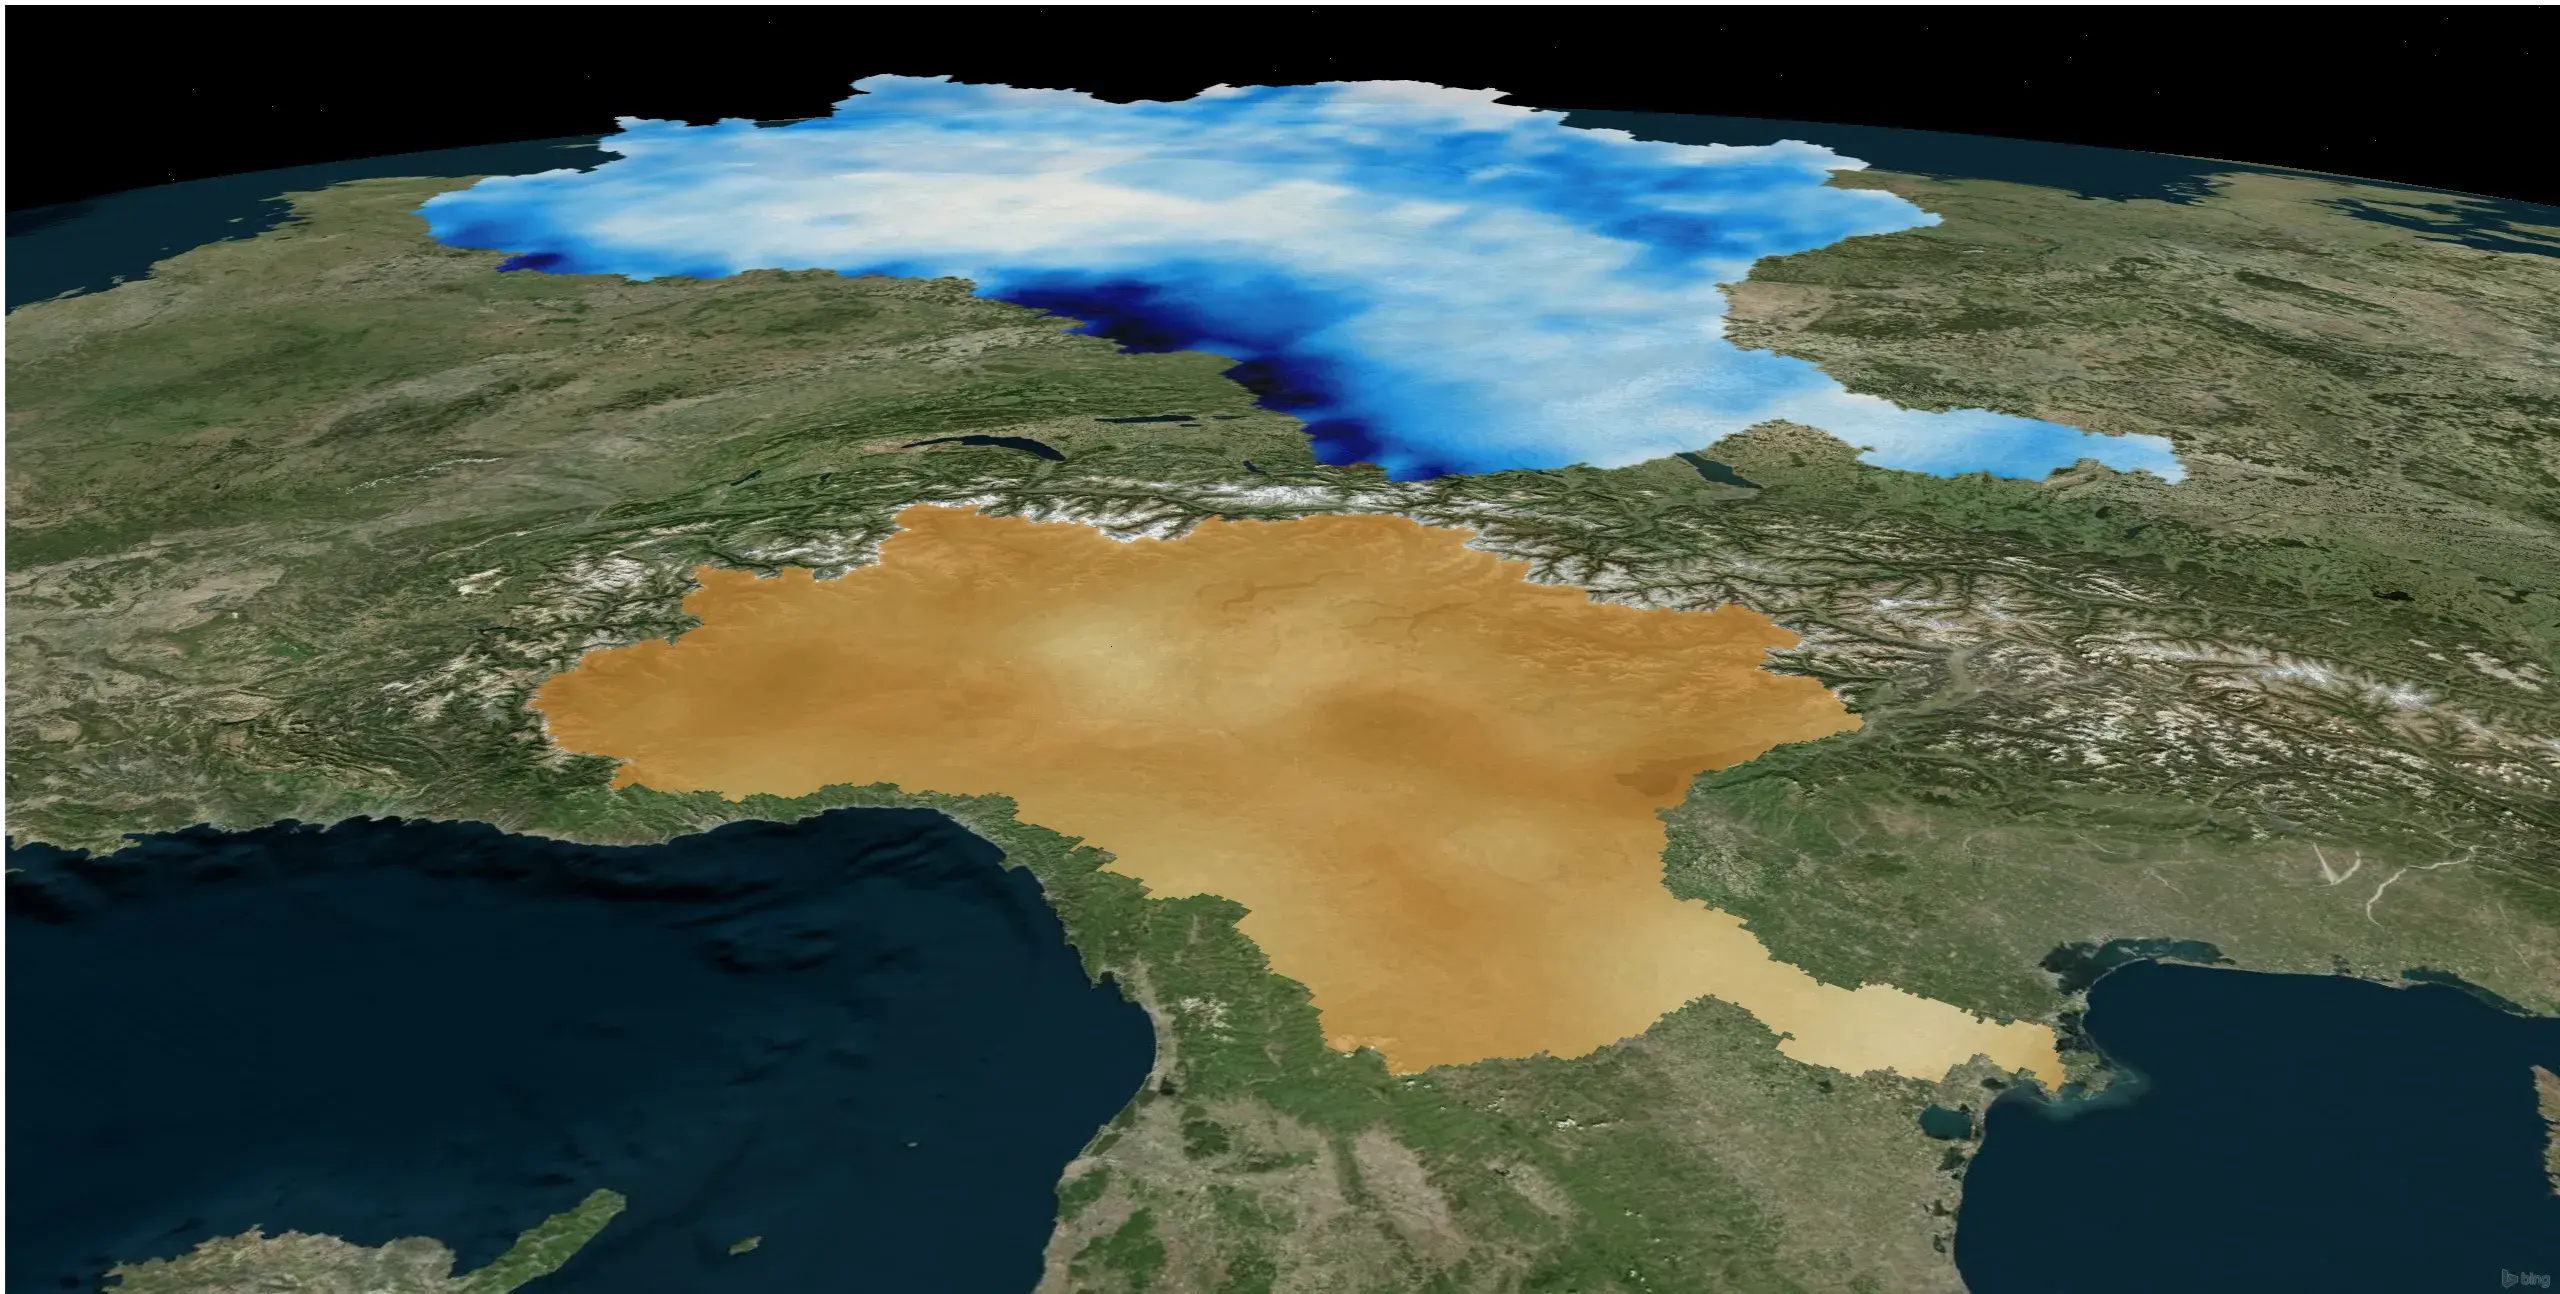
Explore in the map data on precipitation, soil moisture, snow water equivalent, and evaporation during December 2021.
As the different indicators show, the warning signs were there, but Northern Italy’s 2022 drought revealed the high price of inaction.
At the same time, it also highlights the power of DTE Hydrology in replicating events as a key tool for large scale water balance assessment.
DTE Hydrology Platform. Mediterranean basin at 1km spatial resolution for December 2021.
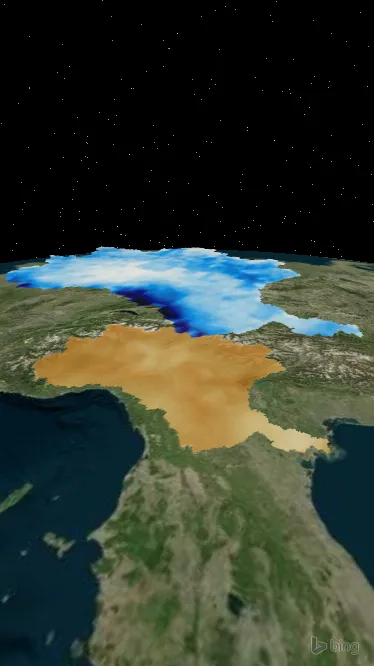
Explore
Explore in the map data on precipitation, soil moisture, snow water equivalent, and evaporation during December 2021.
As the different indicators show, the warning signs were there, but Northern Italy’s 2022 drought revealed the high price of inaction.
At the same time, it also highlights the power of DTE Hydrology in replicating events as a key tool for large scale water balance assessment.

DTE Hydrology supports water management strategies using data on precipitation, soil moisture, snow water equivalent, runoff, and evaporation. It helps decision-makers stay ahead of crises and offers actionable insights for:
Early restrictive measures
To curb water use before supplies run dry.
Resilient infrastructure construction
To safeguard communities against extreme events.
Water storage optimization
To ensure reserves last longer.
Water-smart landscaping and irrigation
To make agriculture more sustainable.
A Vision for the Future
In the coming years, beyond decision makers, DTE Hydrology may also inform farmers in the assessment of risk to their land, individuals in the assessment of property risk, and investors in the evaluation of their investment decisions.
Europe's 2022 drought and the Po River Basin stories explained above are both cautionary tales and calls to action. Tools like DTE Hydrology offer a glimpse of the potential of digital twins for extreme events management.
About
The production of this interactive story has been possible thanks to the efforts of the Digital Twin Earth Hydrology team and Lobelia under ESA EO Science for Society funding in the context of the ESA project Edukeo.
Data used for visualisation has been provided by the DTE Hydrology team.
References
- WMO Atlas of Mortality and Economic Losses from Weather, Climate and Water Extremes (1970–2019). (2021)
- DTE Hydrology Platform (Brocca et al., CNR IRPI for ESA)
- What-if Scenarios: DTE Explorer – Use Case 3
- Flooding Prediction: DTE Explorer – Use Case 2
- Large-Scale Water Balance Assessment: DTE Explorer – Use Case 1
- Montanari, A., et al. (2023). Why the 2022 Po River drought is the worst in the past two centuries. Science Advances, 9(32). https://doi.org/10.1126/sciadv.adg8304
- Clifford, C. (2022). Italy has declared a state of emergency because of drought: “There is no doubt that climate change is having an effect,” the prime minister said. CNBC. https://www.cnbc.com/2022/07/05/italy-declared-a-state-of-emergency-because-of-drought-in-the-po-river.html
- Carrera, L., & Aerts, J. C. J. H. (2015). Economics of flood risk in Italy under current and future climate. CMCC Research Papers, RP0272.
Images and Videos
- Introductory video by Madfor, sourced from PixaBay
- Flooded residential area – Photo by Roschetzky, sourced from iStock.com
- Dried-Up reservoir due to drought – Photo by Cavan Images, sourced from iStock.com
- Severely low water levels in the Po river – Photo by Alessio Bonin, sourced from iStock.com
- Withered maize crops – Photo by Alexandre Rotenberg, sourced from Alamy Stock Photo