Food security and
crop mapping
ESA’s initiative to map crops with EO brings transparency to reduce food speculation and safeguard food security
Often called “the granary of Europe”, Ukraine supplies over 10% of the world’s wheat, barley, and maize.1 When the war began in 2022 global concerns were raised about food security. Within a span of just two weeks, the price of wheat surged by 50%.2 Yet, by the end of the year, global yields were similar to the preceding year.3 This misalignment between yields and prices was partly a result of market speculation: investors anticipating lower yields drove up the price by buying more wheat futures.
How volatile was the monthly average of wheat future prices compared with global wheat production?
The chart compares global wheat production (in million metric tonnes – on the left y-axis) from 1990 to 2023 against the monthly average of wheat future prices (US Dollars per traded unit – on the right y-axis). This shows how future prices are sometimes detached from global yield, particularly in the peaks linked to the global financial crisis (2008) and the Ukraine war (2022).
Explore
Navigate through the graph to discover global wheat production and its price.1,2
Explore
Navigate through the graph to discover global wheat production and its price.1,2
Food speculation first started occurring in the 19th century, when future contracts on food were established to reduce the risk for both producers and wholesalers. Farmers received an upfront price guarantee as well as cash to cover their expenses until harvest, instead of waiting to be paid until the crop was sold. This practice made farming safer and more profitable. Today, the system has grown significantly more complex, and while futures contracts help stabilise production, they can also influence the overall cost of food and contribute to price fluctuations in staple crops like soy, maize, rice, and wheat. Episodes of extreme volatility are a major threat to food security in low-income countries.4 Low-income countries with high debt, who are dependent on food import and foreign aid are the most vulnerable to sudden increases in food prices.
This square represents land use in the world.
The agricultural area represents
36,8%
of the land use worldwide.5
Cereals represent
15%
of all the agricultural area.6,7
Just four crops provide most of the essential nutrients in the human diet worldwide.8
30%
wheat
27,4%
maize
22,4%
rice
20,2%
other coarse grains
Climate change impact on staple crops
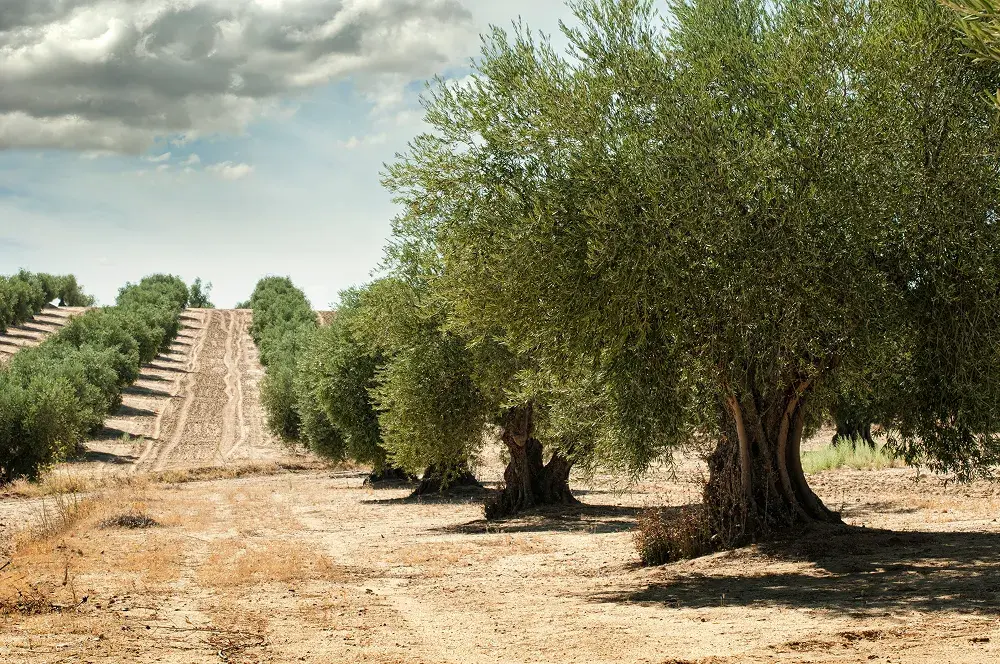
Beyond the impacts of food speculation on food security, climate change is predicted to alter crop production significantly. Warming in temperate climates is expected to increase some yields, such as wheat, and reduce others, such as maize.9 The consequences of the record-breaking drought in Southern Europe led to poor olive harvests in 2023 and a global shortage on supermarket shelves that more than doubled the price.10
To reduce the likelihood of food price volatility and provide market information and transparency, the Agricultural Market Information System (AMIS) was created in 2011 as a coordinated international reaction to the food price hikes in 2008 and 2011.The Global Information and Early Warning System on Food and Agriculture (GIEWS) supports the AMIS mission by providing critical information to the Group on Earth Observations Global Agricultural Monitoring Initiative (GEOGLAM), which in turn informs AMIS.
In a rapidly changing climate, anticipating changes in supply is all the more important, particularly through more reliable crop yield estimates. The earlier we know future yields, the better we can make adjustments to counteract or take advantage of them.
Estimating crop yields is a complex task influenced by various factors, including crop variety, environmental conditions, and agricultural practices, all of which interact dynamically. While significant progress has been made in refining these estimations, achieving a globally applicable system remains a challenge. A crucial first step is collecting accurate data on the geographical distribution of crops and available stocks.
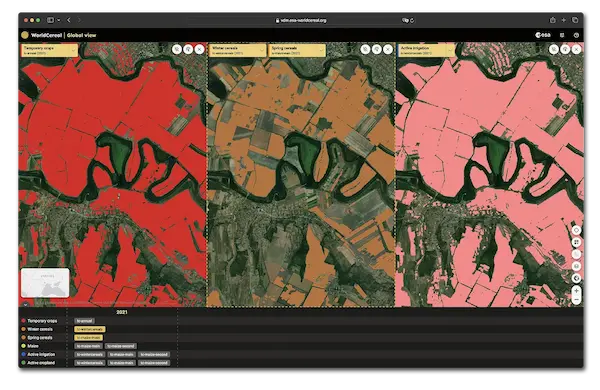
ESA contributes to these international efforts through satellite imagery. As part of the WorldCereal project, ESA provides high-resolution global maps of croplands, crop types, and irrigation, offering valuable insights for improving yield estimations worldwide.
The WorldCereal system is an Earth Observation centred system for crop mapping that includes harmonised observed ground data for cropland and crop type classification, developed collaboratively with partners and farmers.11
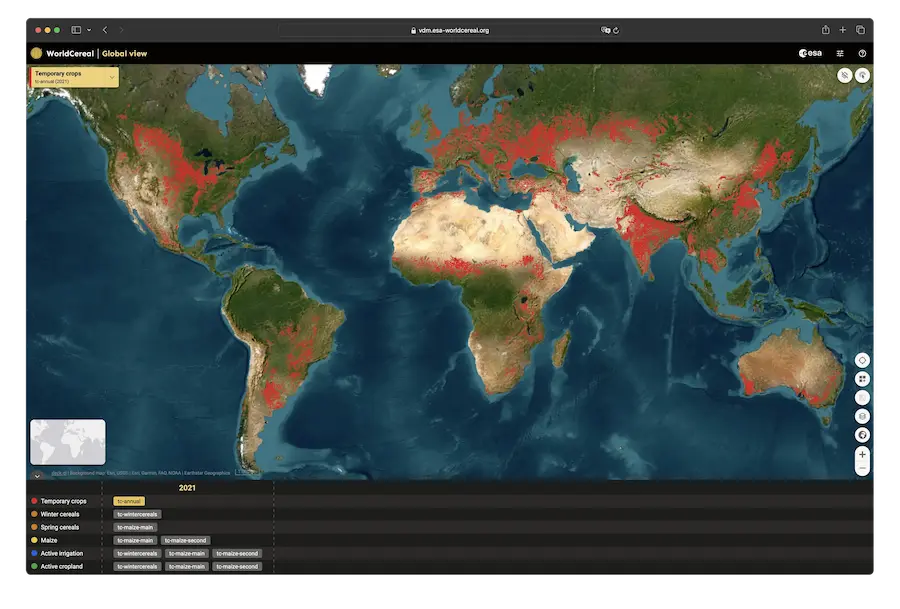
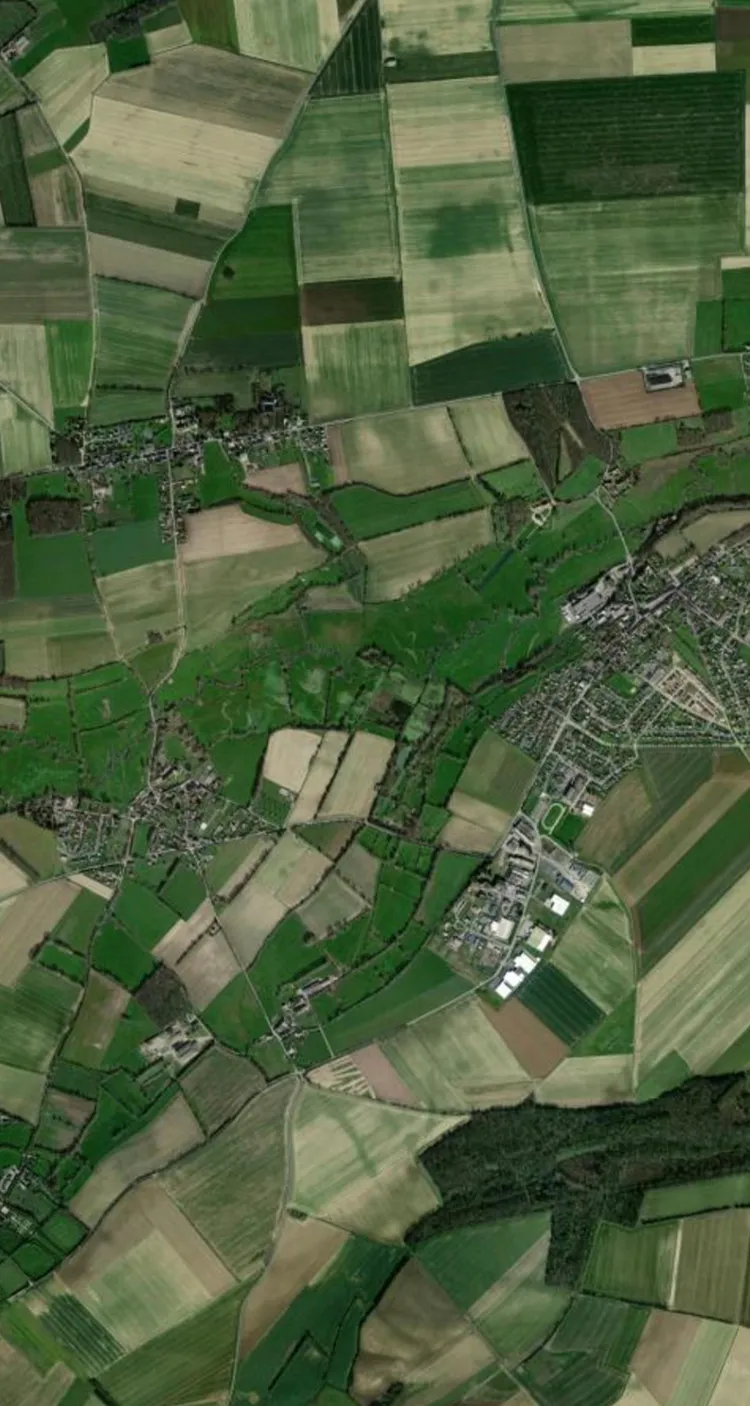
View temporary crops worldwide
Temporary crops are defined as crops harvested within one year after sowing/planting and include cereals, vegetables, dry pulses (beans) and oilseed crops (soy, rapeseed), among others.
This information is available at 10 meter resolution in WorldCereal.12

Explore
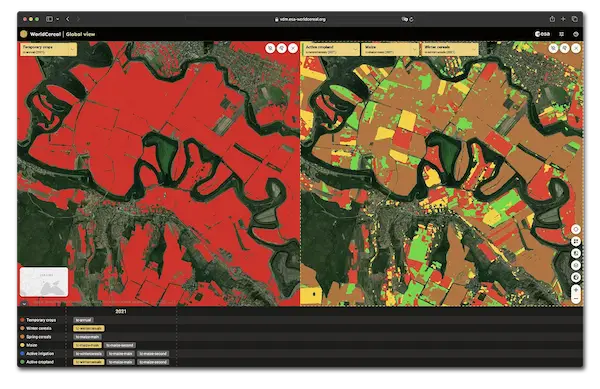
Focusing on Ukraine, where more than 10% of the world’s wheat, barley, and maize are produced1, you can compare crop types.12
Maize
Winter Cereals
**Winter cereals include wheat, barley, and rye.
Crop mapping identifies areas of cultivated fields and provides specific details about the type of crop grown in each area. In the past, this process relied on cadastres, which are legally defined land parcels. Using satellite imagery reduces the effort required for data collection, and improves accuracy, especially in regions where cadastres may be absent or inconsistently maintained, or where crop rotation is used.
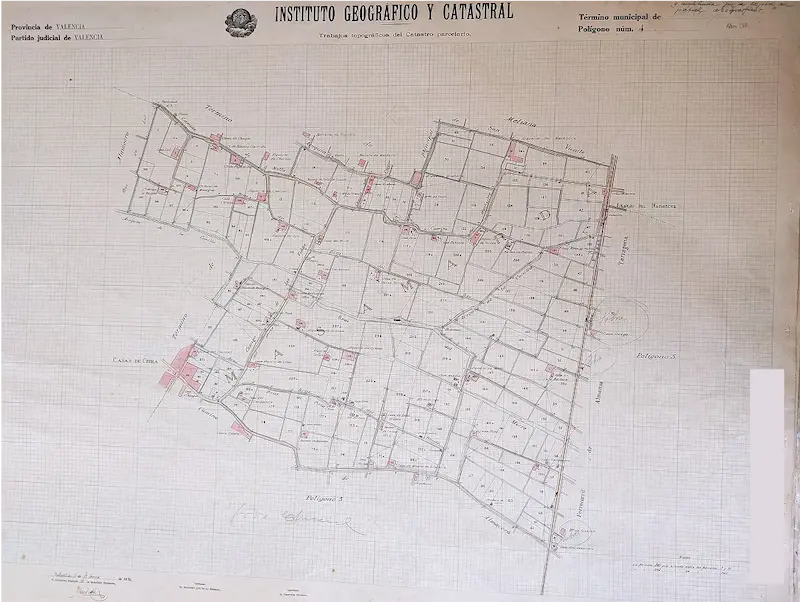
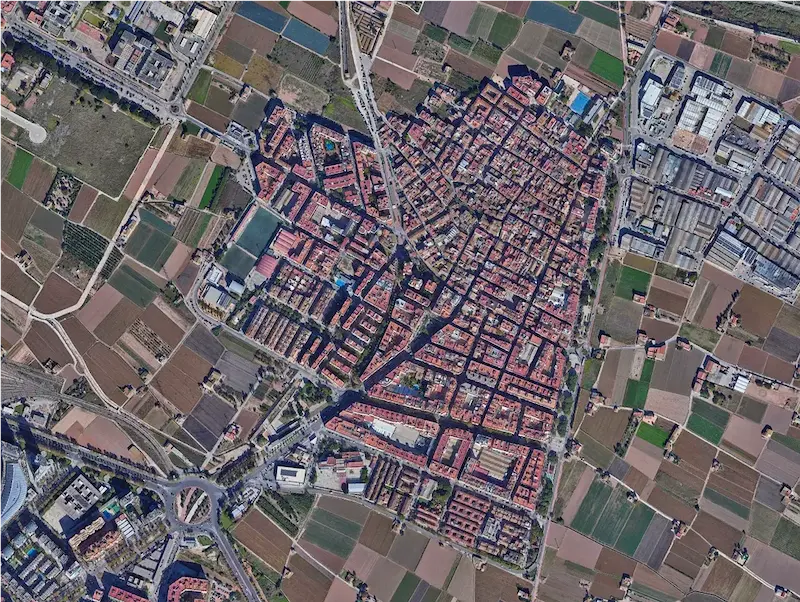
Old cadastral maps were used for detection of crop changes. TopLeft: Topographical cadastral maps of Alboraya (1930-2013). BottomRight: A satellite image of the region shows greater detail.
Currently, WorldCereal displays global crop maps for the year 2021, encompassing cereals (wheat, barley and rye together) and maize. In the near term, the “cereals” class will be split into individual crops and a longer time period will be implemented. Additional crops to be included in the system are sunflower, rapeseed, millet, sorghum, and soybean.
Processing tools for agricultural monitoring
The current tool is already a powerful visualisation tool. Besides offering a global view of crop cultivation, it enables the monitoring of seasonal fluctuations, a critical aspect for identifying crop growth patterns. These patterns can vary significantly from year to year depending on the types of crops cultivated. “Visualising crop rotation patterns helps us assess the potential changes in agricultural practices of a region and align those with our understanding of soil health,” says Sven Gilliams, Program Director at GEOGLAM.
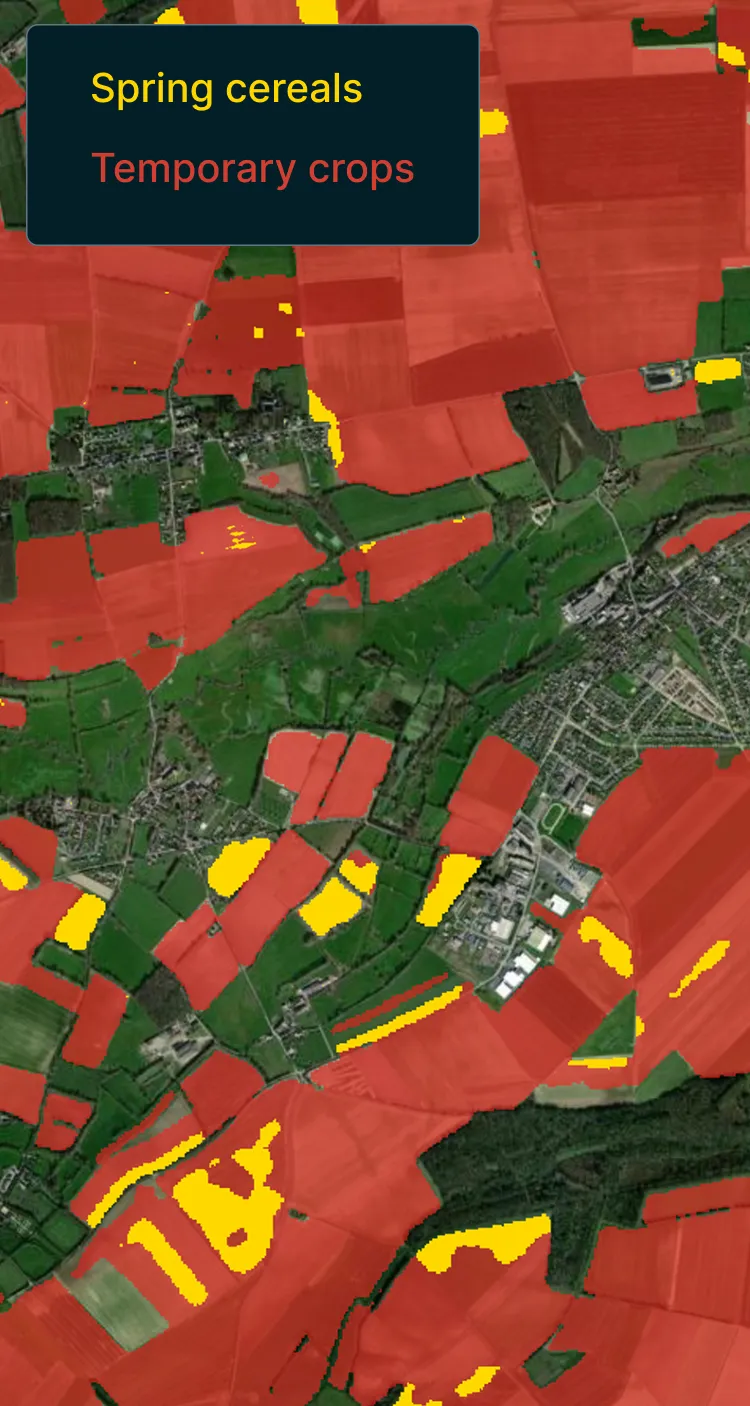
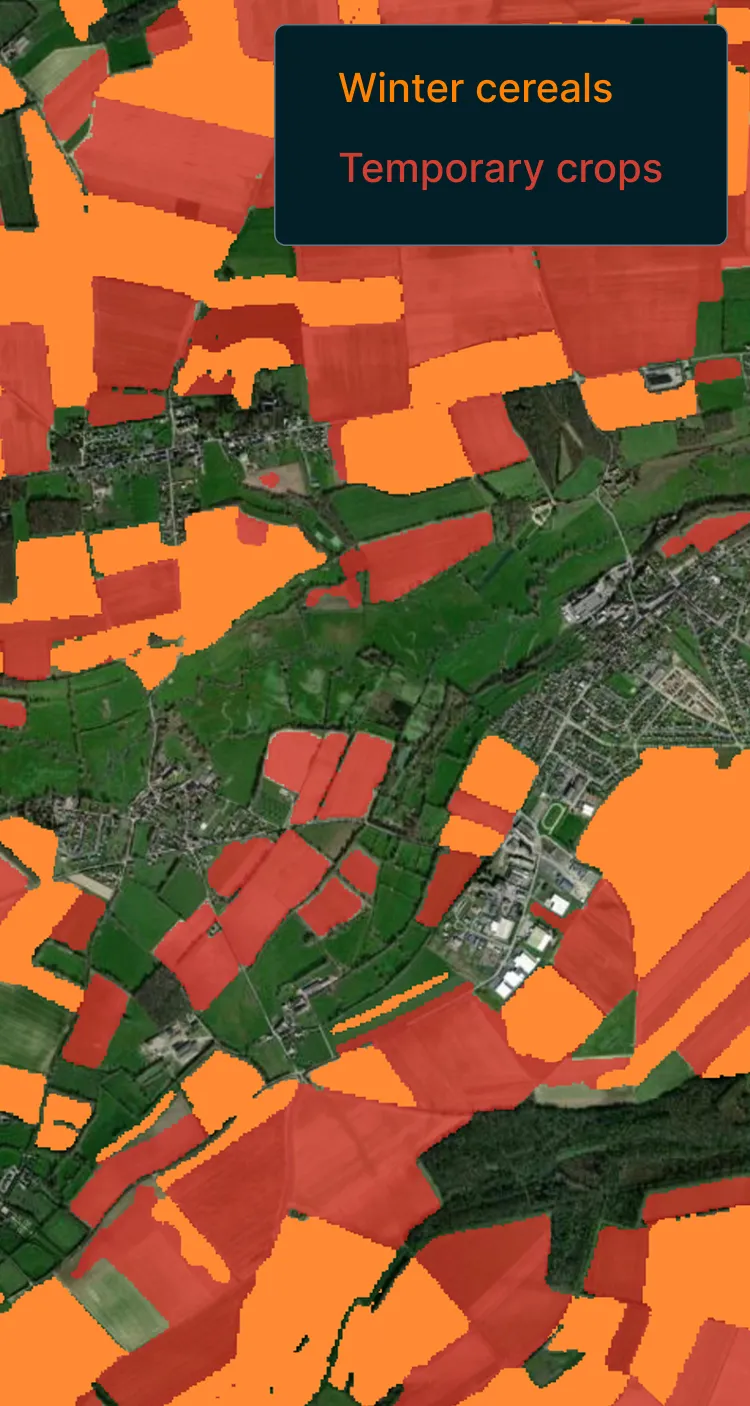
The WorldCereal system allows for the production of season-specific crop type maps. This visualisation displays areas covered by temporary crops (in red) and makes the distinction between cereals grown in the winter season (orange) versus cereals grown in the spring season (yellow).
Approximately 70% of global freshwater13 withdrawals are used for irrigation, essential for sustaining crop yields. However, with climate change likely to cause water shortages in many regions, it is vital to monitor irrigation practices and prioritize crop varieties suited to water-scarce conditions.
Globally, 70% of freshwater is used for agriculture
Agriculture is the largest user of freshwater. The graph shows the global share of freshwater use by sector in 2021. 13
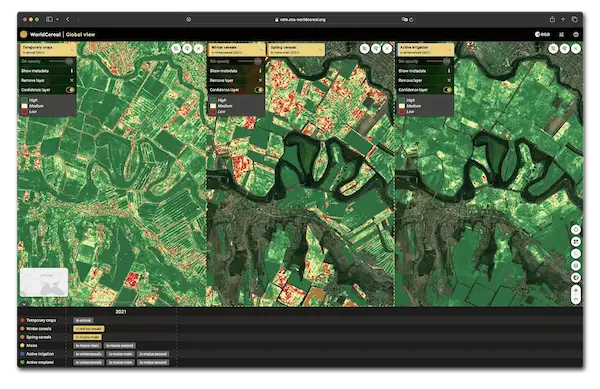
The WorldCereal system uses satellites to map irrigated parcels, enabling water management agencies to compare the actual irrigation practices to the reported water use and detect potential discrepancies. This facilitates a comparison with local or national water management plans, ensuring alignment and spotting potential issues, related to the type of water scarcity. Moreover, studying correlations between actively irrigated parcels and crop types can provide insights into the consequences of crop choices on water use. “Such knowledge could inform policymakers to encourage drought-compatible crops, particularly in regions experiencing increasingly low precipitation levels,” says Dr. Zoltan Szantoi, Land Application Scientist at the European Space Agency.
First steps of a long term vision
While the online viewer showcases the visible part of the tool, the system is constituted by the software behind it, which relies on machine learning models, and on the extensive in situ database collected among the user community to run state-of-the-art classification algorithms. This way, WorldCereal functions as an open-access system which can be utilised by UN agencies, national governments, or any type of organisation interested in monitoring global production, anticipating shortages, or reducing speculation and food price volatility. As Dr. Szantoi says, “The best achievement of this ESA initiative is the creation of a fully customizable processing system able to meet a diverse set of crop type related processing requests that supports local to global food security analysis.”
Comprehensive insights into crop types, growth periods, and irrigation practices are steps towards being able to estimate yields and establish early warning systems for food security. In the meantime, global crop mapping based on Earth Observation provides data and transparency to mitigate food speculation and contribute to market stability, safeguarding vulnerable populations and ensuring a more secure future for global agriculture.
About
The production of this interactive story has been possible thanks to the efforts of the WorldCereal Platform and Lobelia under ESA EO Science for Society funding in the context of the European project Edukeo.
References
- FAO’s Engagement in Ukraine, Family Farming Knowledge Platform (2022). Food and Agriculture Organization of the United Nations. https://www.fao.org/family-farming/detail/en/c/1476928
- Wheat price data: Macrotrends. https://www.macrotrends.net/2534/wheat-prices-historical-chart-data
- Wheat production data: Food and Agriculture Organization of the United Nations (2025), data processed by Our World in Data. https://ourworldindata.org/grapher/wheat-production?tab=chart&country=~OWID_WRL
- Prakash, A. (2011). Safeguarding food security in volatile global markets. [online] Food and Agriculture Organization of the United Nations (FAO).
- Agricultural land percentage: https://data.worldbank.org/indicator/AG.LND.AGRI.K2
- Land under cereal production: https://data.worldbank.org/indicator/AG.LND.CREL.HA
- Total agricultural land: https://data.worldbank.org/indicator/AG.LND.AGRI.ZS?view=chart
- Global agricultural land use by major crop type: https://ourworldindata.org/grapher/global-agricultural-land-use-by-major-crop-type
- Jägermeyr, J. et al. (2021). Climate impacts on global agriculture emerge earlier in new generation of climate and crop models. Nature Food.
- Butler, S., Jones, S. and Smith, H. (2023). Europe’s olive oil supply running out after drought – and the odd hailstorm. The Guardian.
- Van Tricht, K. et al. (2023) WorldCereal: a dynamic open-source system for global-scale, seasonal, and reproducible crop and irrigation mapping. Earth System Science Data.
- World Cereals Global Crop Maps 2021. The globe is a lower resolution representation of the WorldCereals dataset, at roughly 0.5 km, indicating the percentage of temporary crops (0-100%) for each pixel. World Cereals Global. https://esa-worldcereal.org/en/products/global-maps
- FAO. 2022. The State of the World’s Land and Water Resources for Food and Agriculture – Systems at breaking point. Main report. Rome. https://doi.org/10.4060/cb9910en
Images and Videos
- Introductory video by Роман Раскошный, sourced from Pexels
- Olive trees photo by deyangeorgiev, sourced from IStock
- Old cadastral maps of Alboraya sourced from Femenia-Ribera, C. & Mora-Navarro, G. (2023) Boletín de la Asociación de Geógrafos Españoles.com
- Satellite image of Alboraya - Google Earth Pro
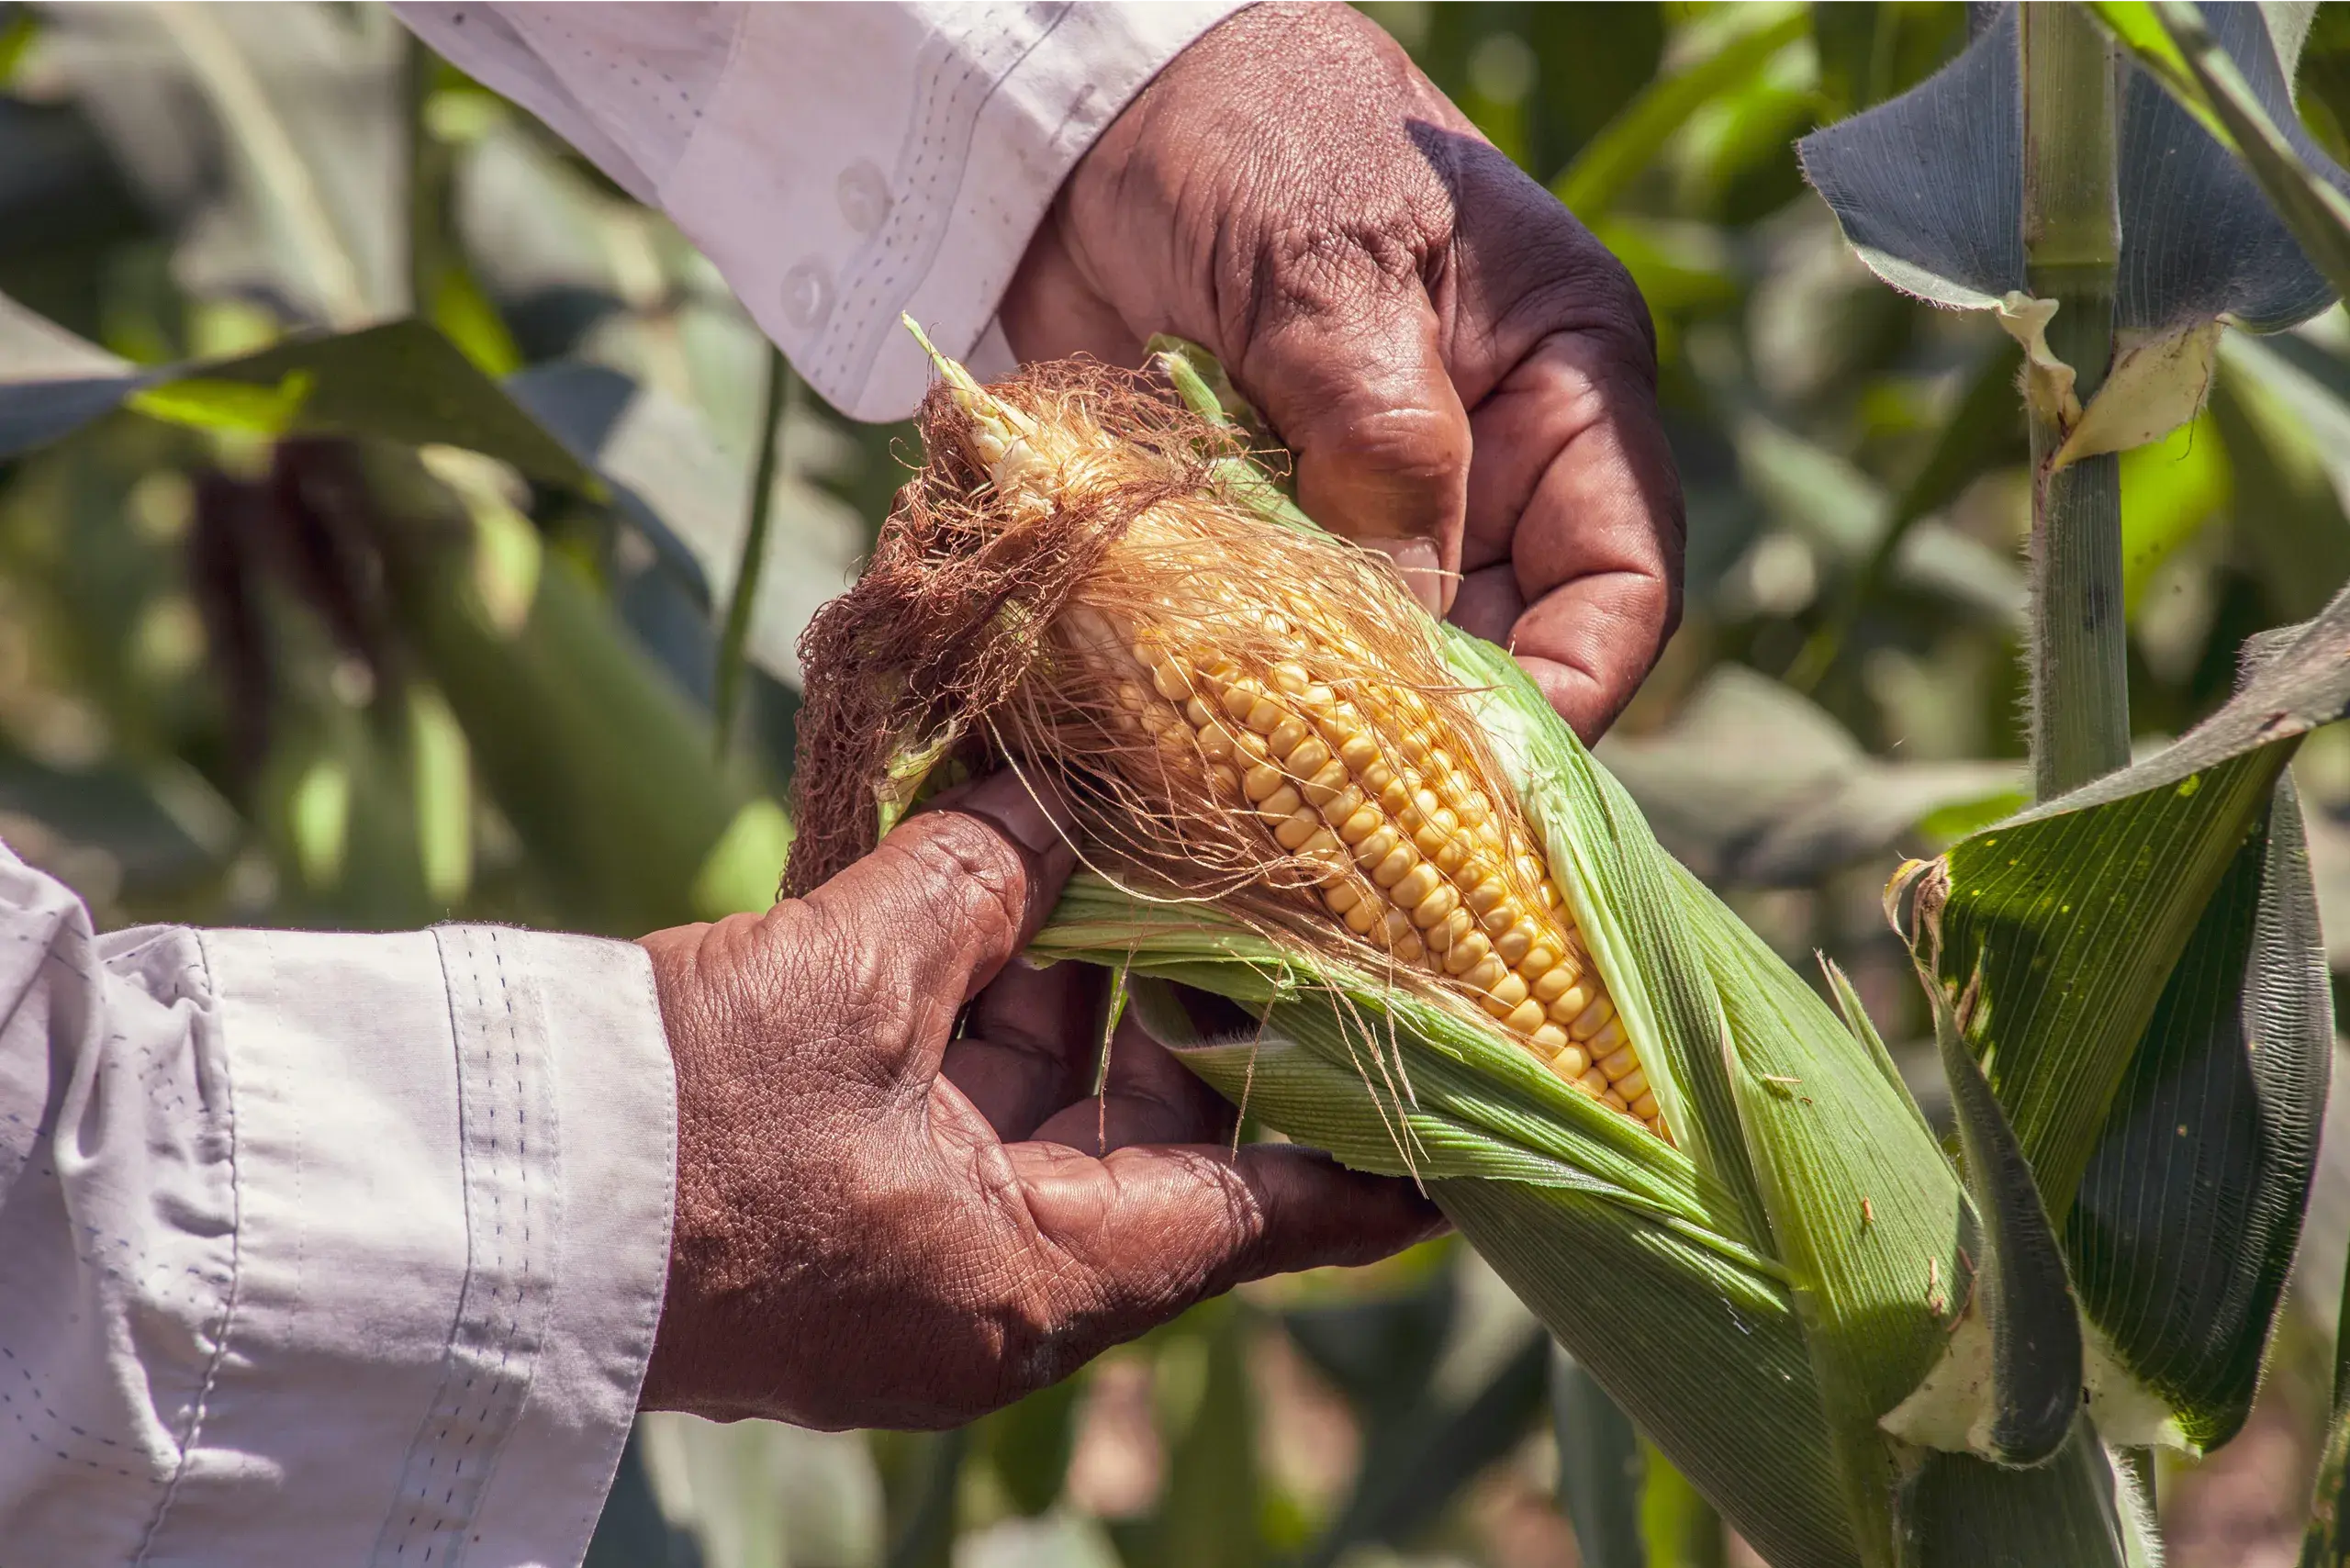
- Farmer holding maize photo by Frank Meriño, souced from Pexelsoto