Coastlines in retreat:
The growing battle against erosion
Can satellite data help turn the tide?
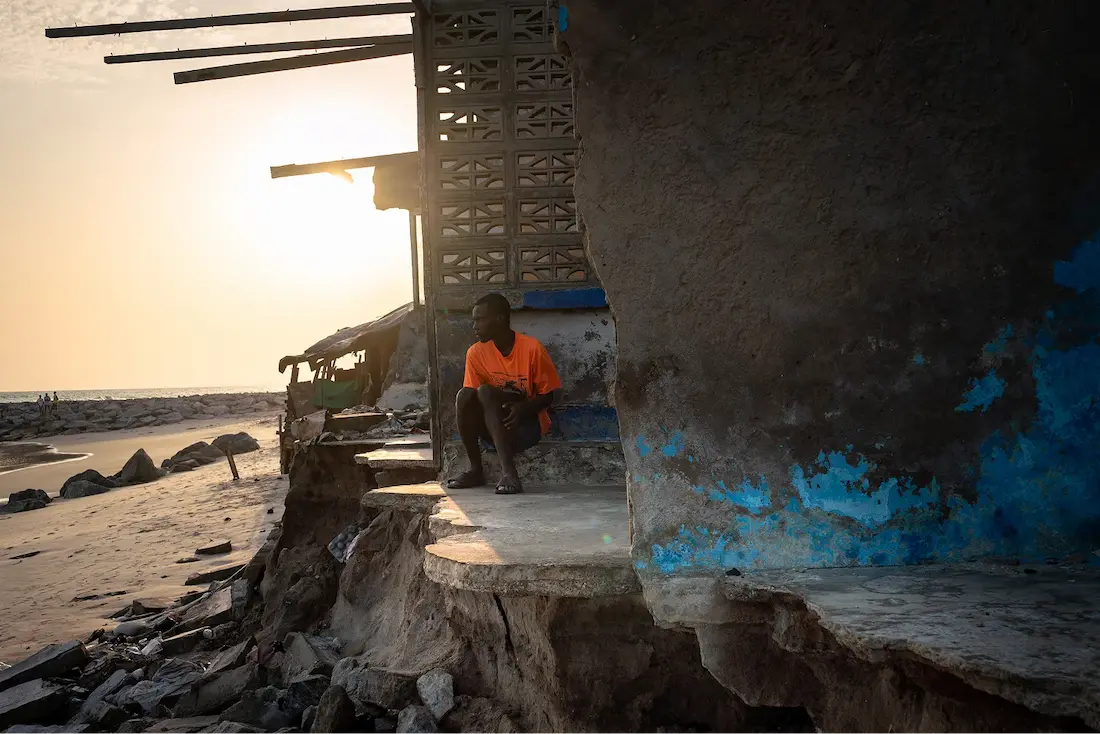
The coastline is a highly dynamic landscape constantly shaped by waves, currents, storms, and human activity.
Water is a powerful element, able to carve through stone and reshape the boundary between sea and shore, whether slowly over centuries or with sudden intensity. When sediment is lost and not replenished along the coast, either because of natural or human dynamics, it is called coastal erosion.
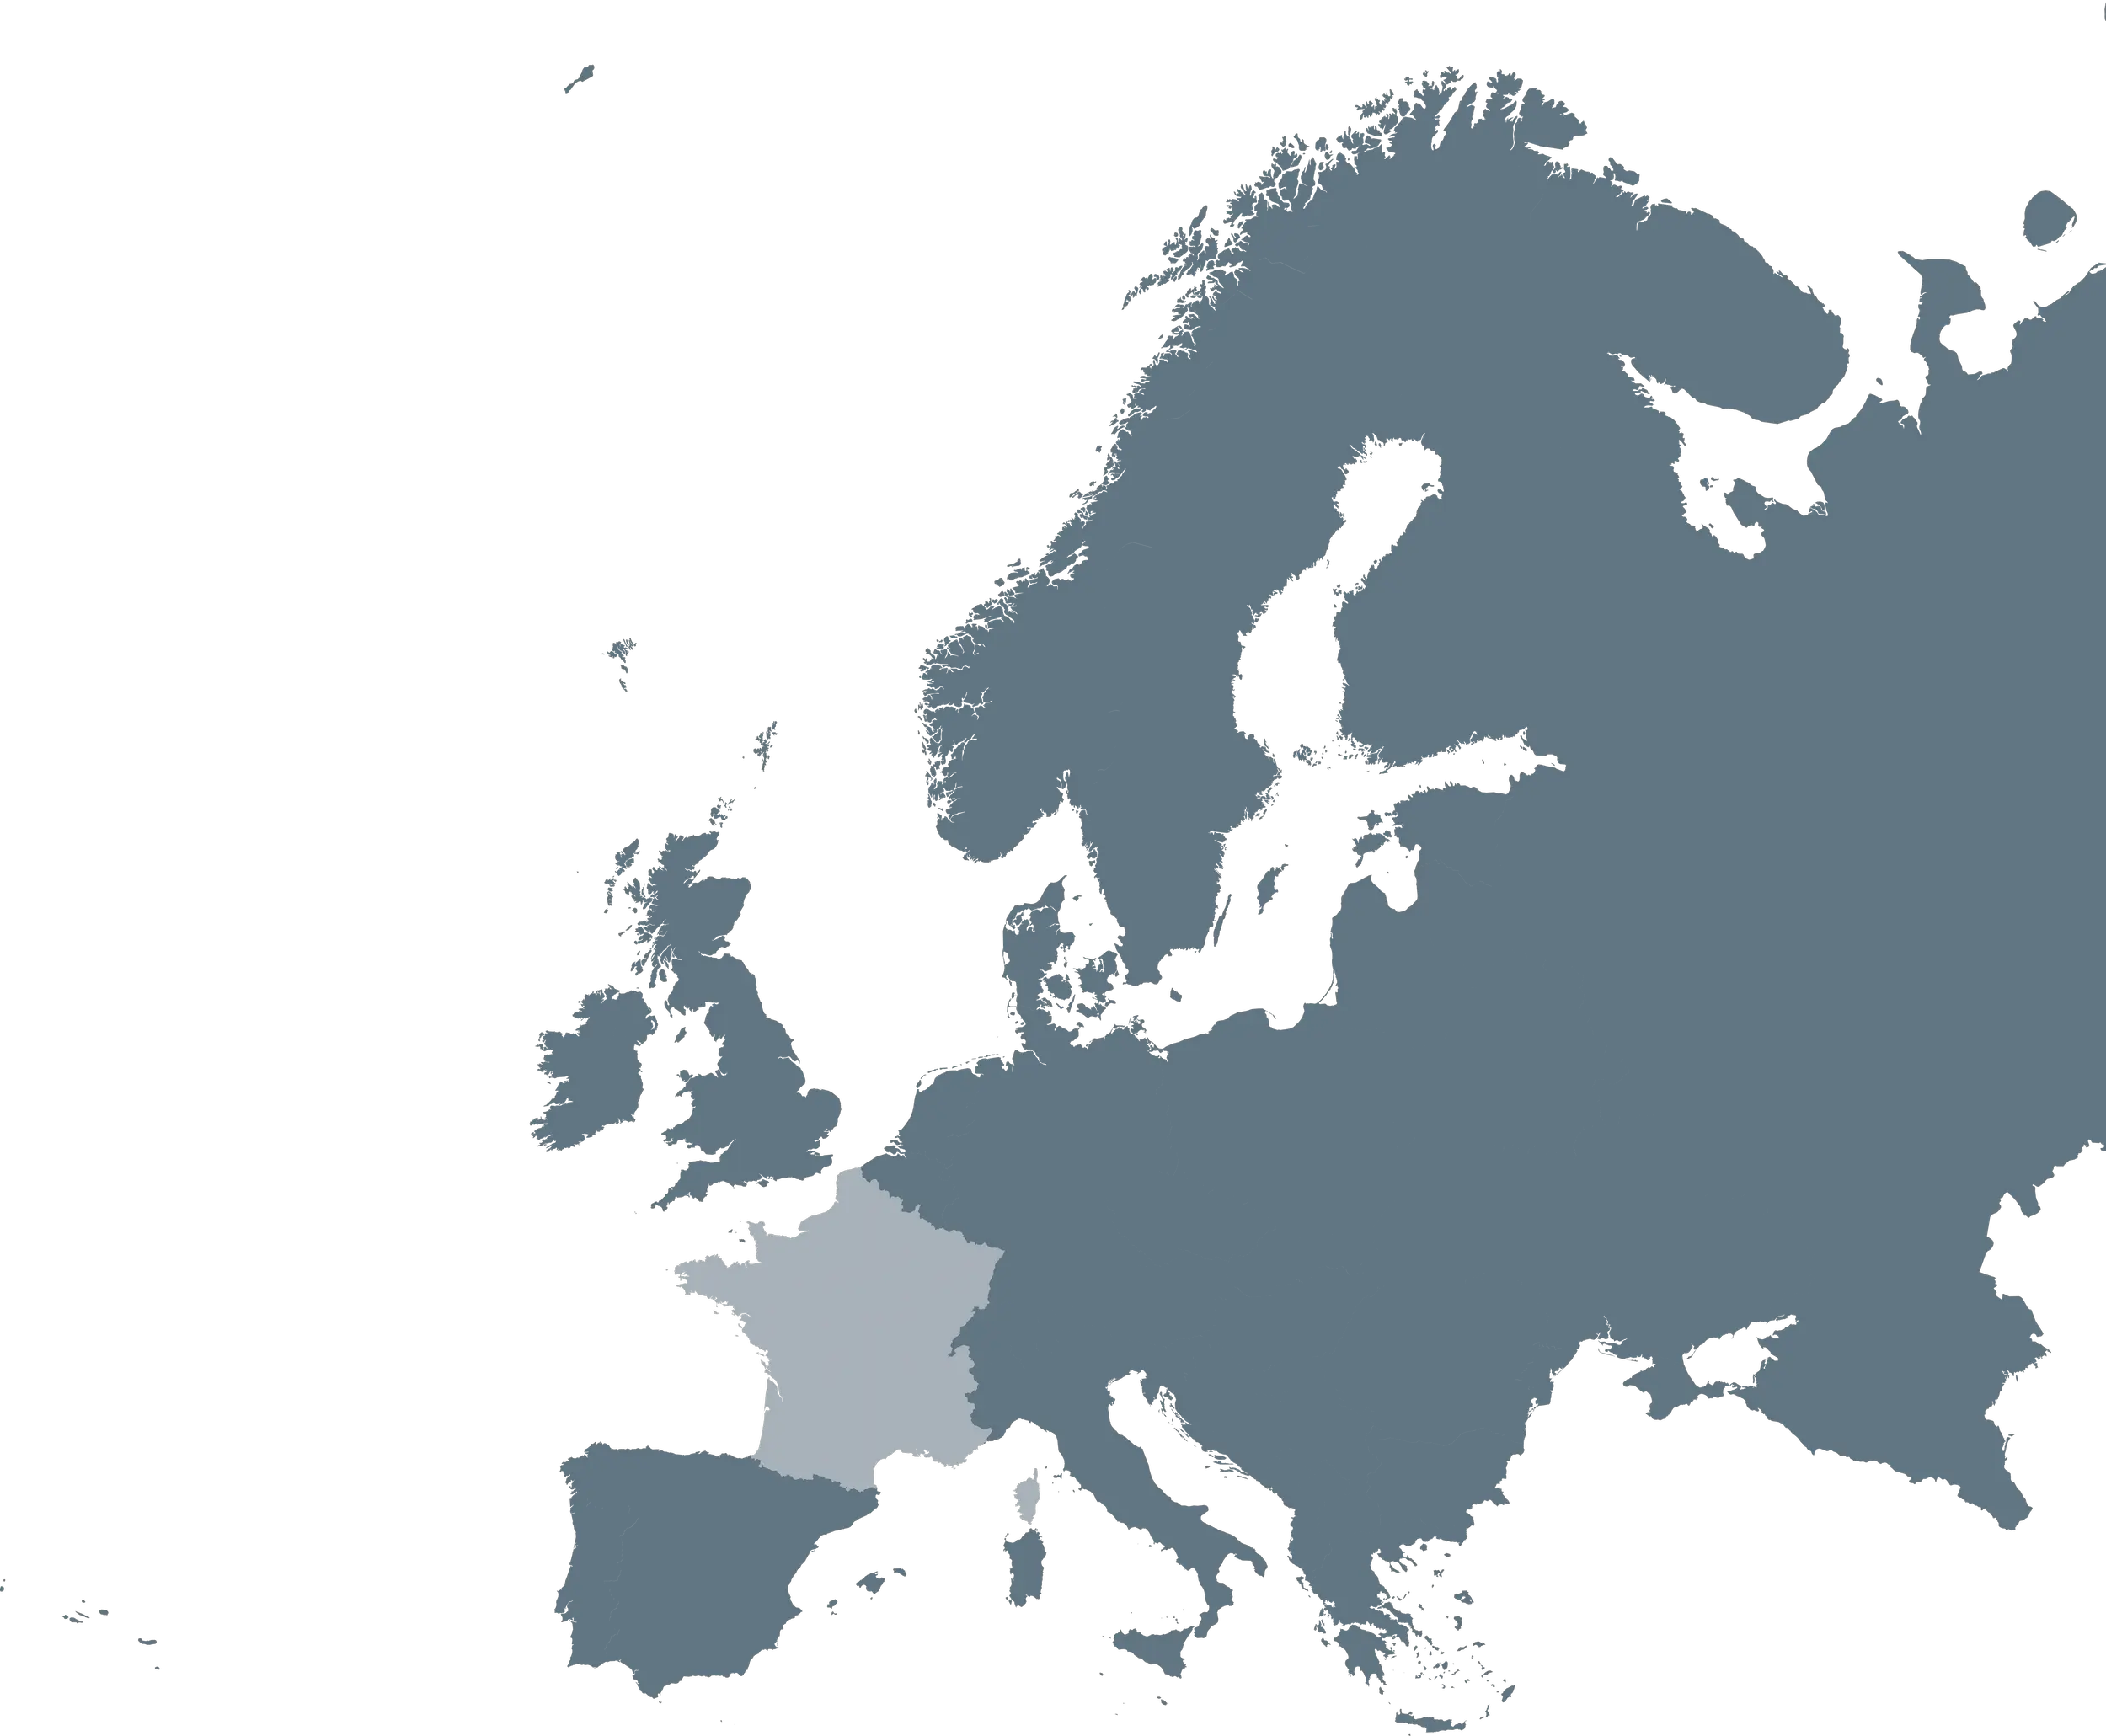
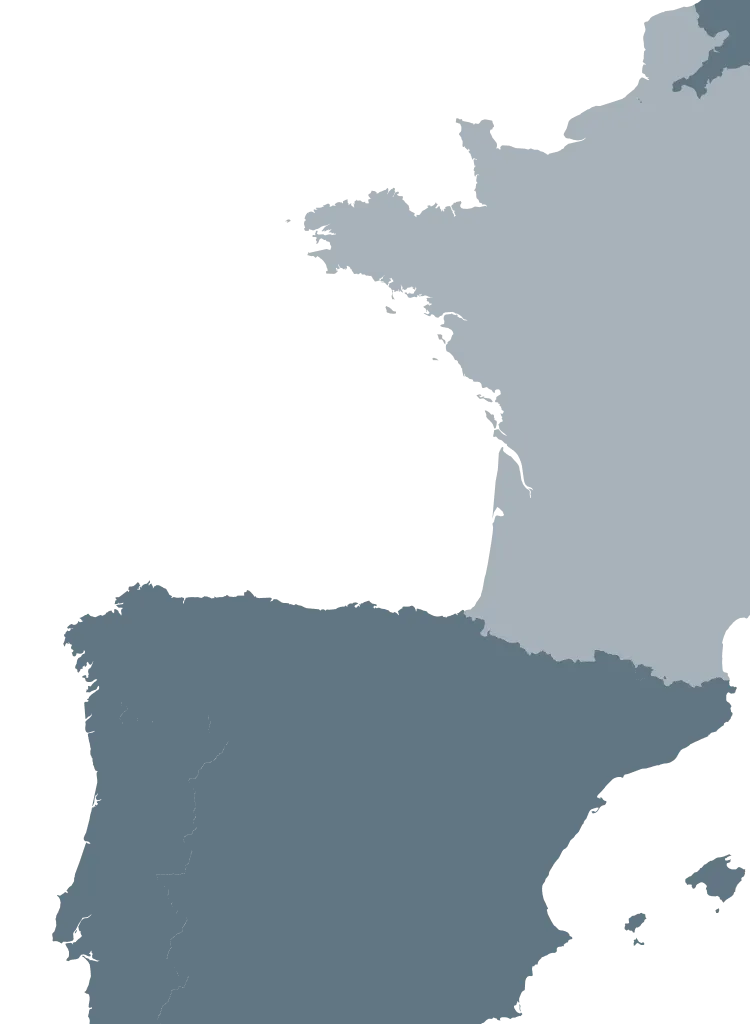
In Soulac-sur-Mer near Bordeaux, France, a single building serves as a vivid example of how coastal erosion hazards intertwine long and short term impacts.
Le Signal apartments were built in the 60s, more than 200 meters away from the ocean and behind a vegetated dune.
Decades of slow, steady erosion weakened the foundation.
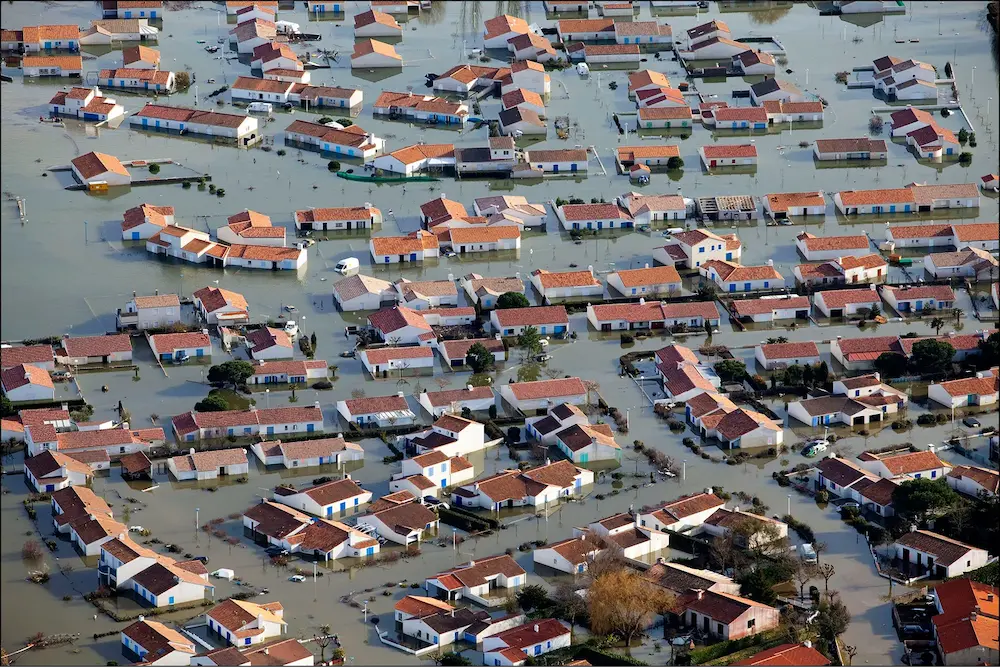
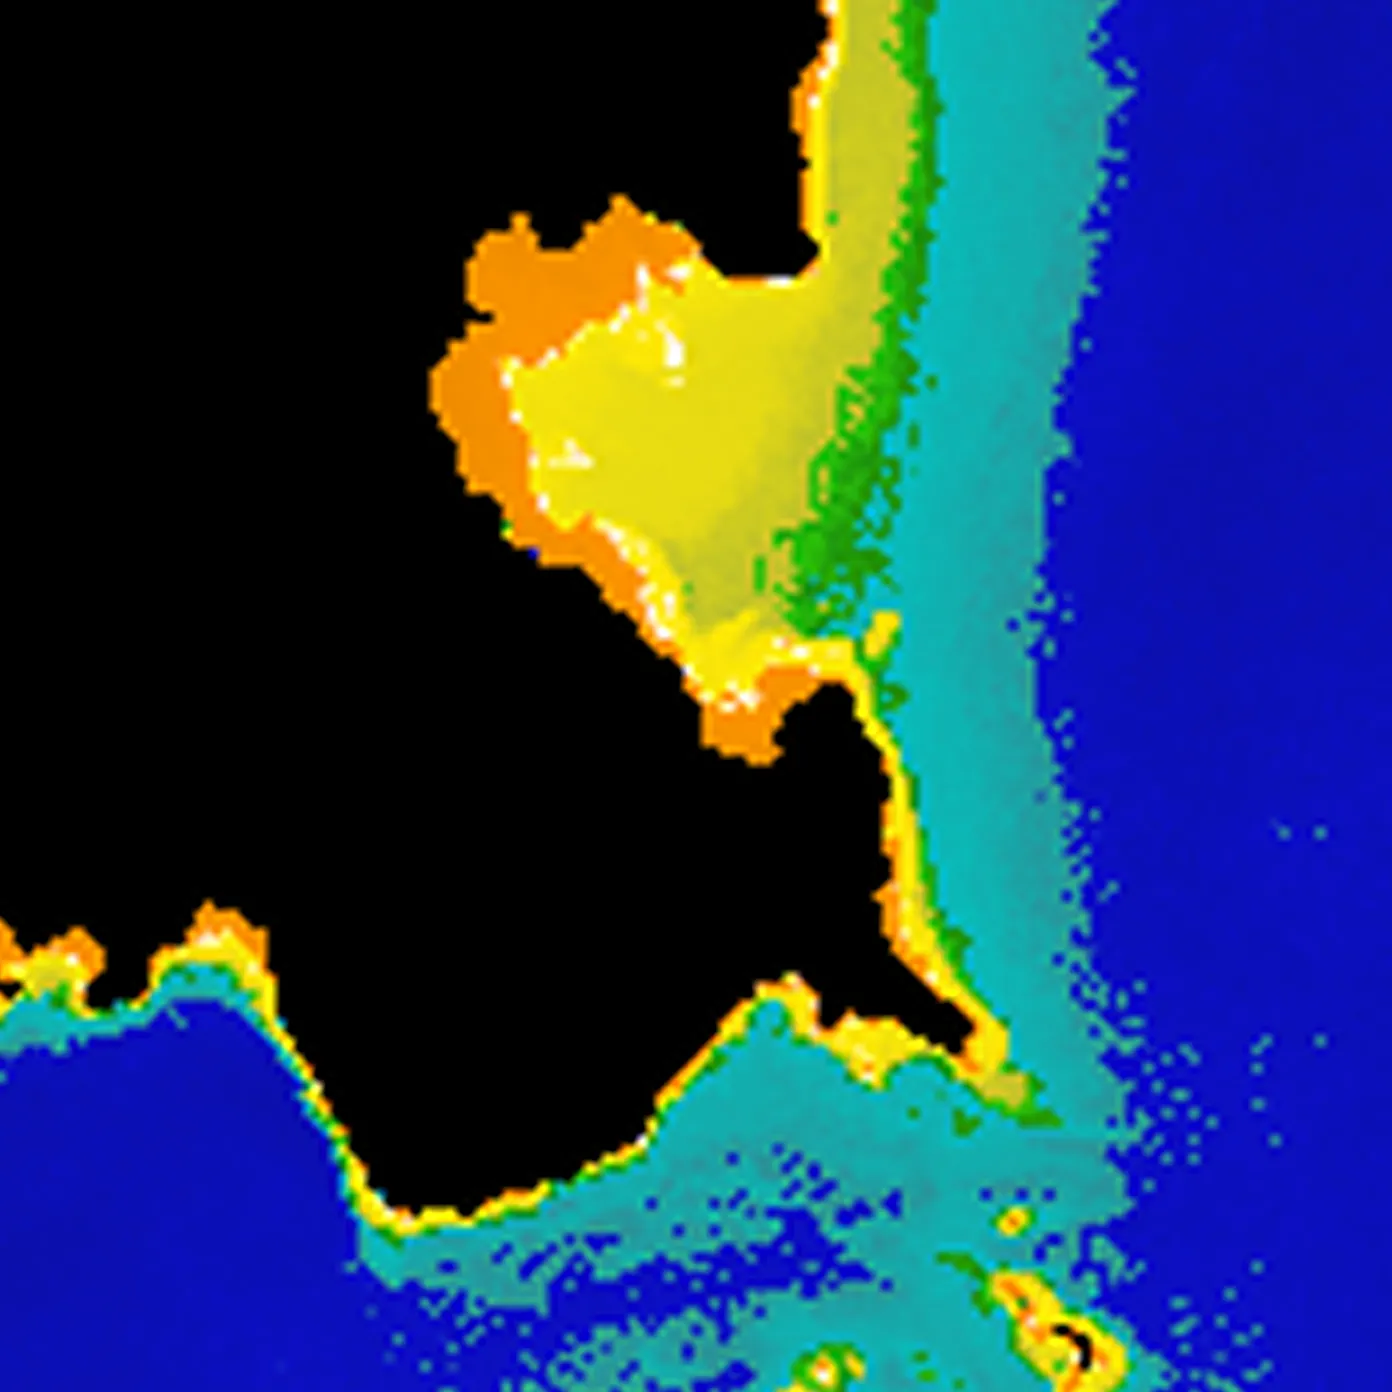
In 2010, Storm Xynthia hit Europe and caused 15 meters of erosion along the sandy Atlantic coastline.
The combination of strong winds, powerful breaking waves, and a high tide completely washed away protective dunes and breached sea walls around the area.
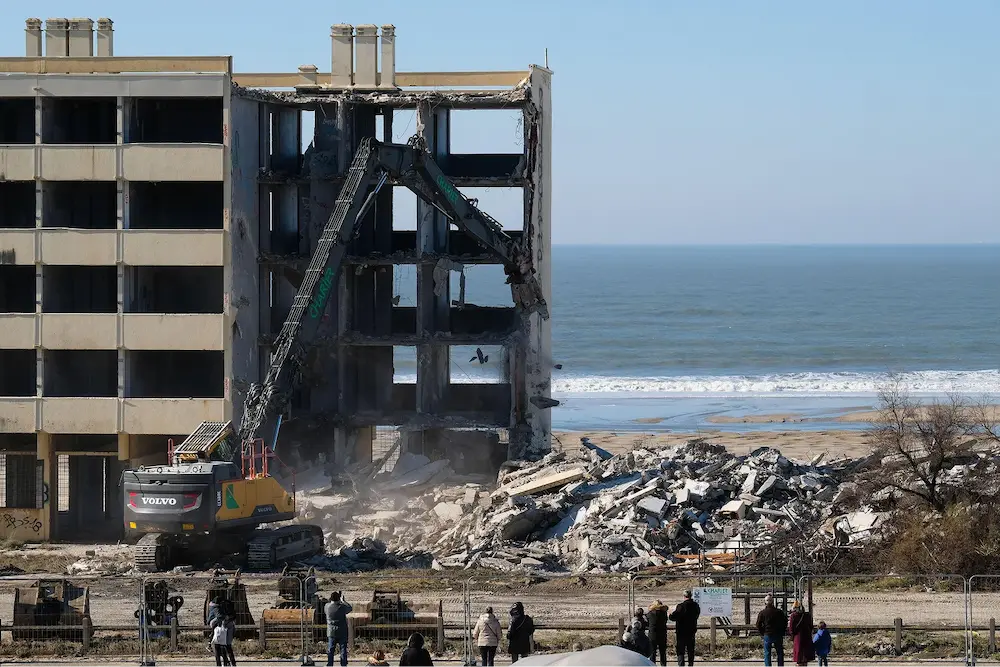
Storm Xynthia delivered a fatal blow to the Le Signal building.
Though it remained standing, the structure was severely destabilised, resulting in its evacuation in 2014, after a series of high tides.
On February 3, 2023, Le Signal was demolished.
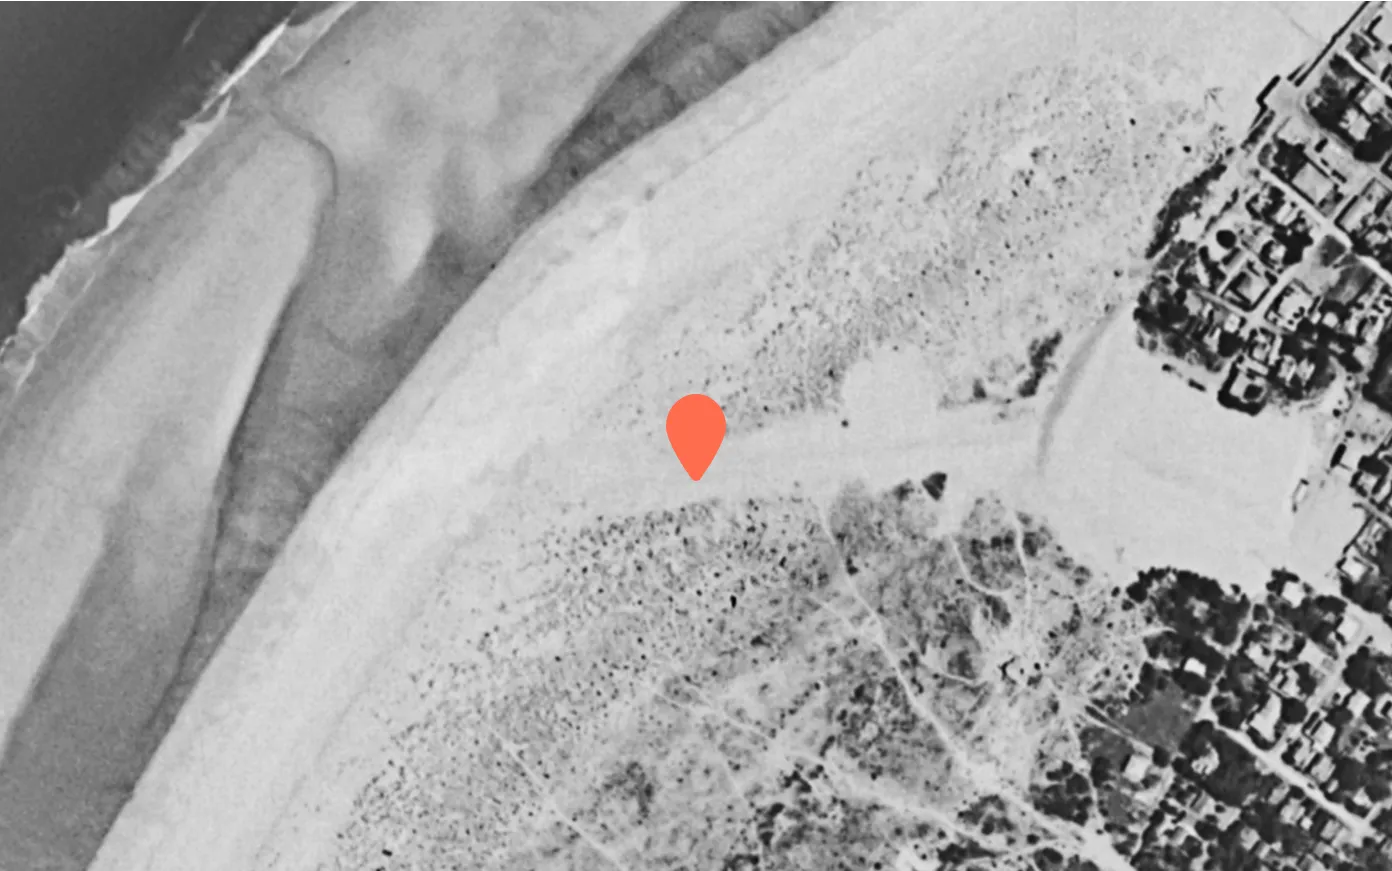
Coastline before construction Aerial view (1950-1965)
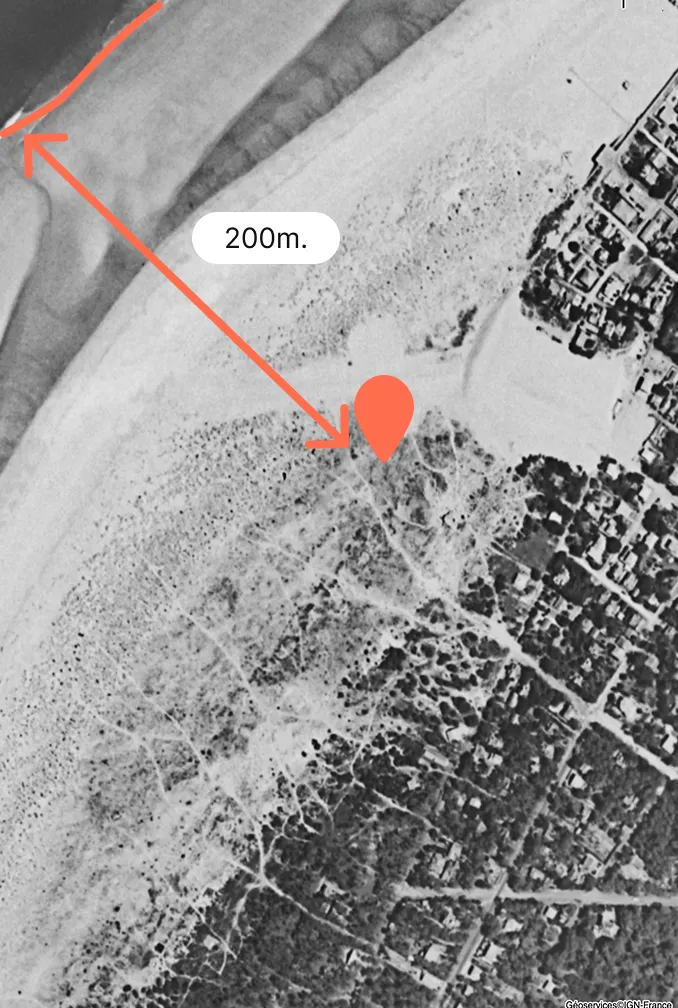
Coastline after evacuation Aerial view (2011–2015)
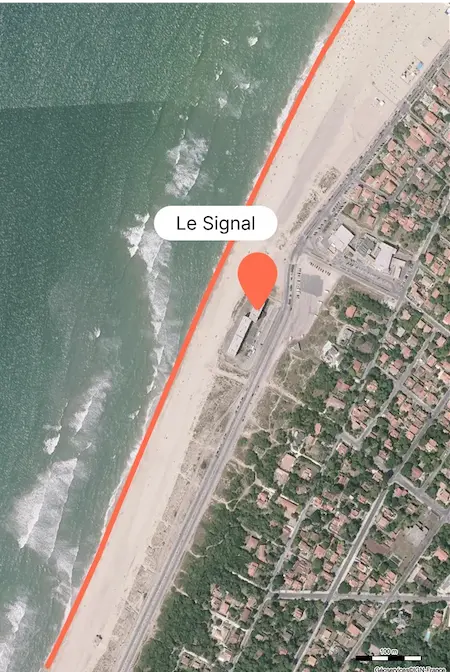
Le Signal, built in 1967, once stood 200 meters from the shorelline. By 2015, the building was separated from the ocean by only 17 meters of dune at the closest measurement, and by 25 meters at the farthest point.
15 years after Xynthia, coastlines are increasingly vulnerable
Coastal populations are growing, and ongoing development accelerates shoreline erosion and increases vulnerability. In many cases, coastlines have been transformed by infrastructure and artificial beaches, which degrade natural protections against erosion, including dunes, salt marshes, seagrass beds and estuaries.
Nearly three billion people, 38% of the global population, live in coastal regions where cities are becoming increasingly concentrated.
View the map of 1239 coastal cities, many of which are rapidly expanding despite vulnerability to sea level rise and erosion.
Coastal urban population
All this happens while climate change drives rising sea levels and bigger storms. More frequent and extreme storms allow waves to reach further inland and erode beaches, cliffs, and dunes, hastening the retreat of coastlines.
Projected global mean sea level change
Global mean sea level change relative to 1900 is predicted to increase exponentially under both moderate emissions (SSP 2-4.5) and high emissions (SSP 5-8.5) scenarios. 2, 3
Populations worldwide are becoming more vulnerable, especially in low and middle income countries, due to limited coastal monitoring and adaptation, weak regulations, and lack of technology to protect vulnerable areas.
Navigating coastal protection strategies
Short-term thinking about coastal management provides temporary solutions but fails to address long-term and multi-scale coastal erosion that will only be amplified over the years by climate change.
For instance, beach nourishment—bringing in sand to replenish eroded areas—is a costly practice that may preserve the beach for the tourist season, but requires a quantity of repeated applications that can be difficult to estimate as the sand is gradually or suddenly washed away throughout the year.
Protecting the coastline and beach infrastructure requires long term thinking and a suite of adaptive solutions.
Revealing the full picture of coastal dynamics
The endless variability of coastlines in geology, slope, weather and wave patterns adds complexity to long term, effective coastal protection and adaptation. Understanding the drivers behind coastal change is essential to designing effective responses.
Are changes part of a seasonal cycle where sand washes away in one season and builds up in another? Are changes driven by natural or human activities? Where is erosion especially destabilising the coast, and what is the rate of change?
Satellite monitoring enables coastal management planning based on spatial and temporal scales that respect natural dynamics. Rather than being constrained by administrative and budget boundaries that often limit field surveys and other assessment methods, satellite products fill the need for more comprehensive monitoring of the dynamics of change.
With over 40 years of global satellite data available, long-term coastal change is revealed, capturing seasonal shifts, and annual and decadal trends.
Click on the indicators of coastal dynamics to learn how satellite data can continuously monitor changes in the coastline
Shoreline trends
What
The waterline is a snapshot of the edge of the ocean at a single point in time, and is used to calculate changes in the shoreline, which is the generic term for the coastal limit.
How
Satellite images of the waterline are corrected with tidal heights to reveal the position of the shoreline.
Why
Monitoring the shoreline reveals coastal change: erosion, accretion (the deposit of sediment), or the gradual submersion of land due to rising sea levels.
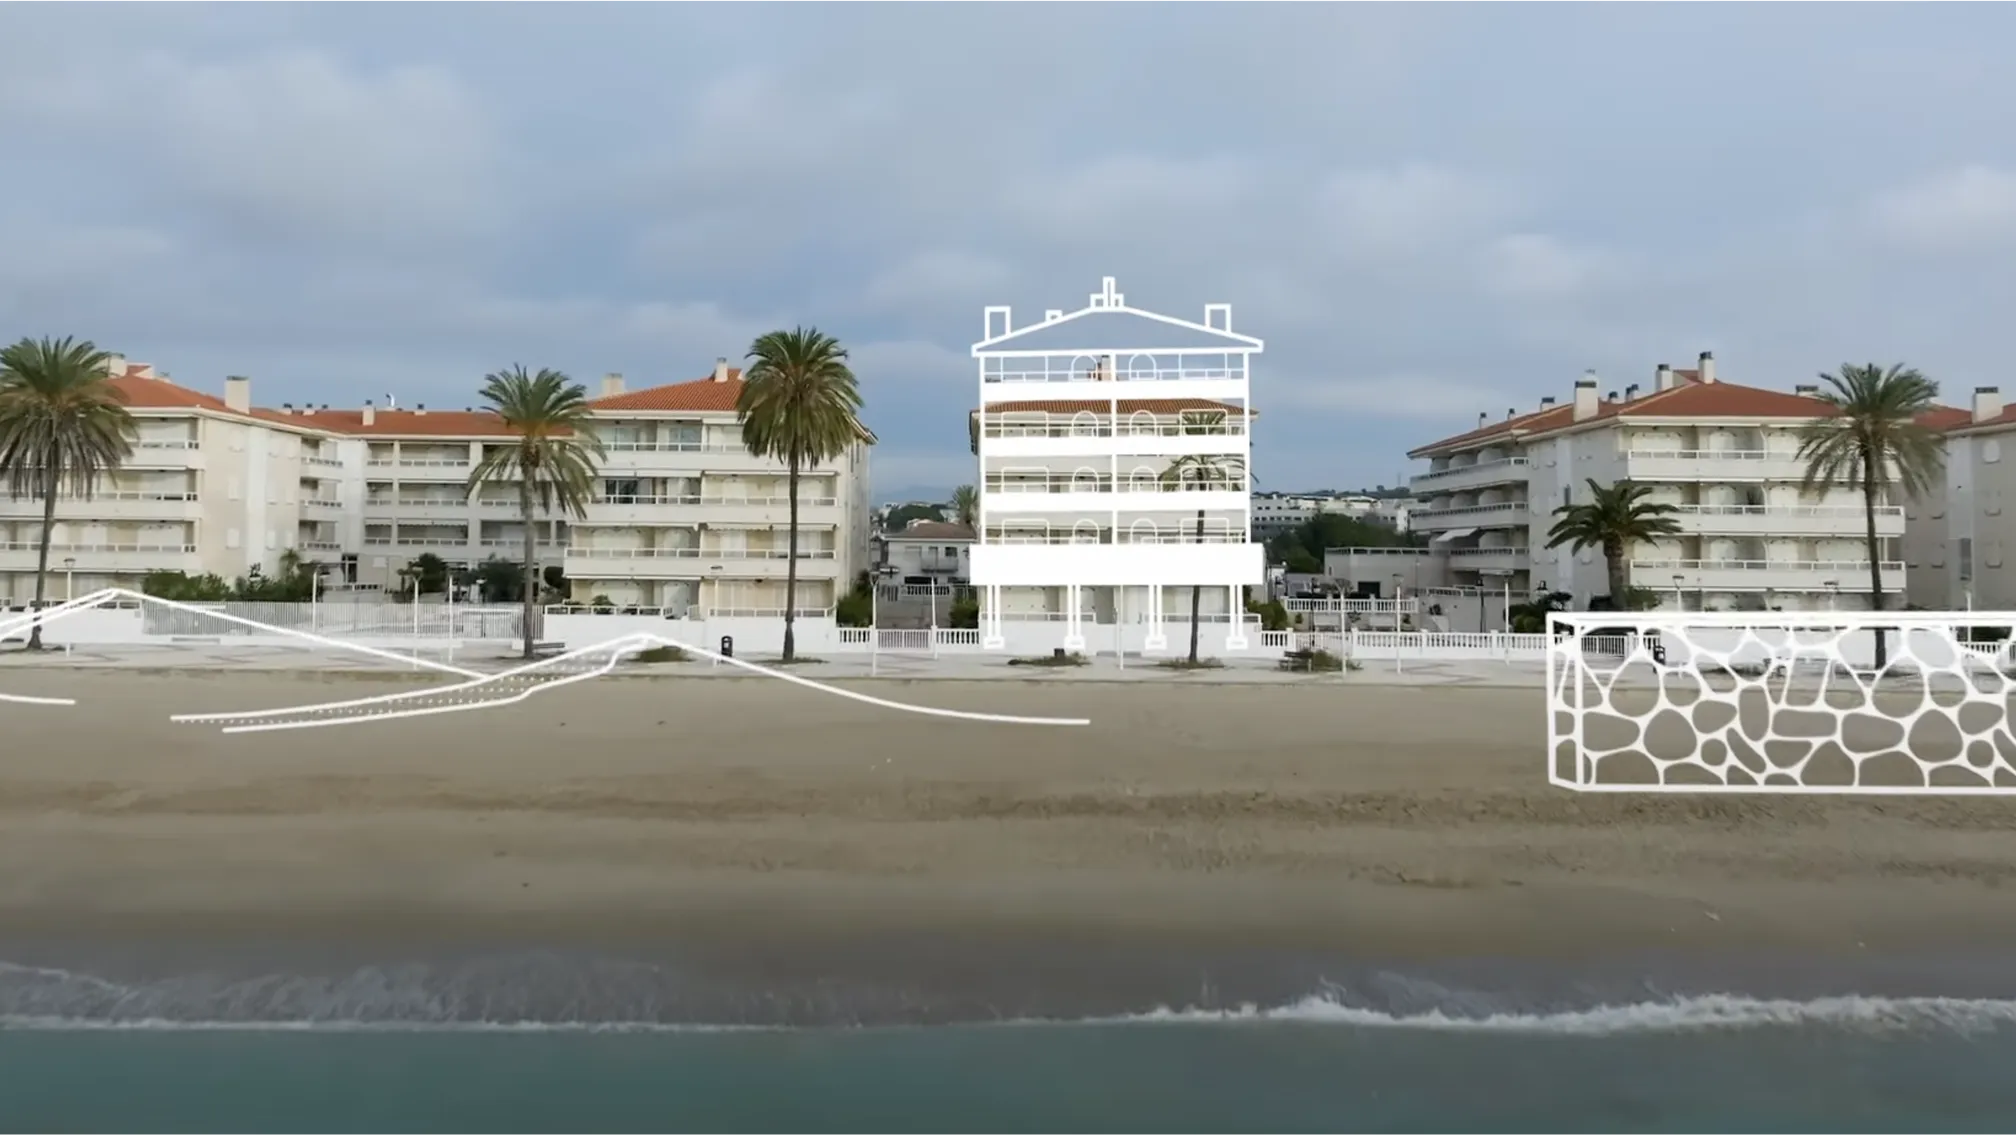
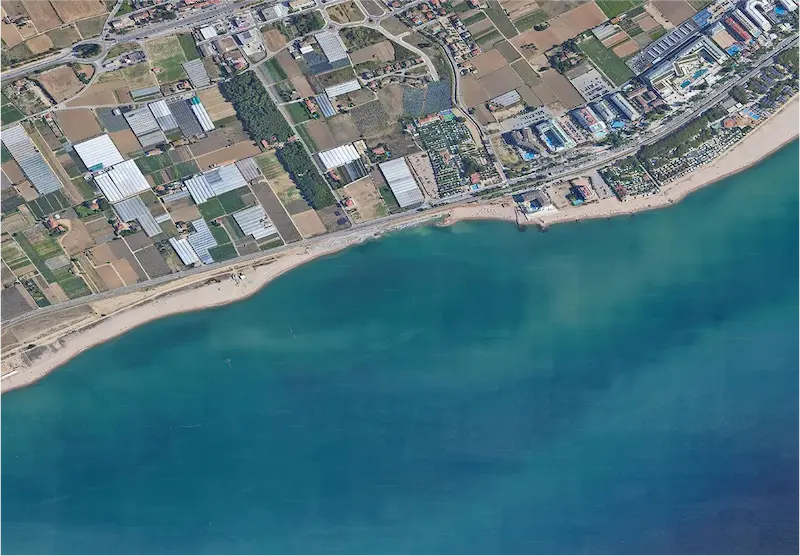
Santa Susana, Spain
1984–2023
Shorelines
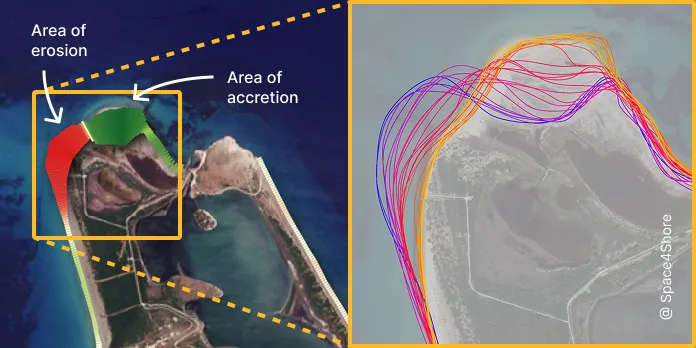
Coastal reshaping
What
Monitoring waterlines (a snapshot of the water limit at a single point in time) can indicate the reshaping of peninsulas over time.
How
Satellites take regular, frequent snapshots of the waterline over many years to track when changes occur.
Why
The shifting shape of the coastline can disrupt ecosystems by burying habitats, creating navigation hazards, and damaging infrastructure.
Cape Araxos, Greece
1955-2020
Waterlines

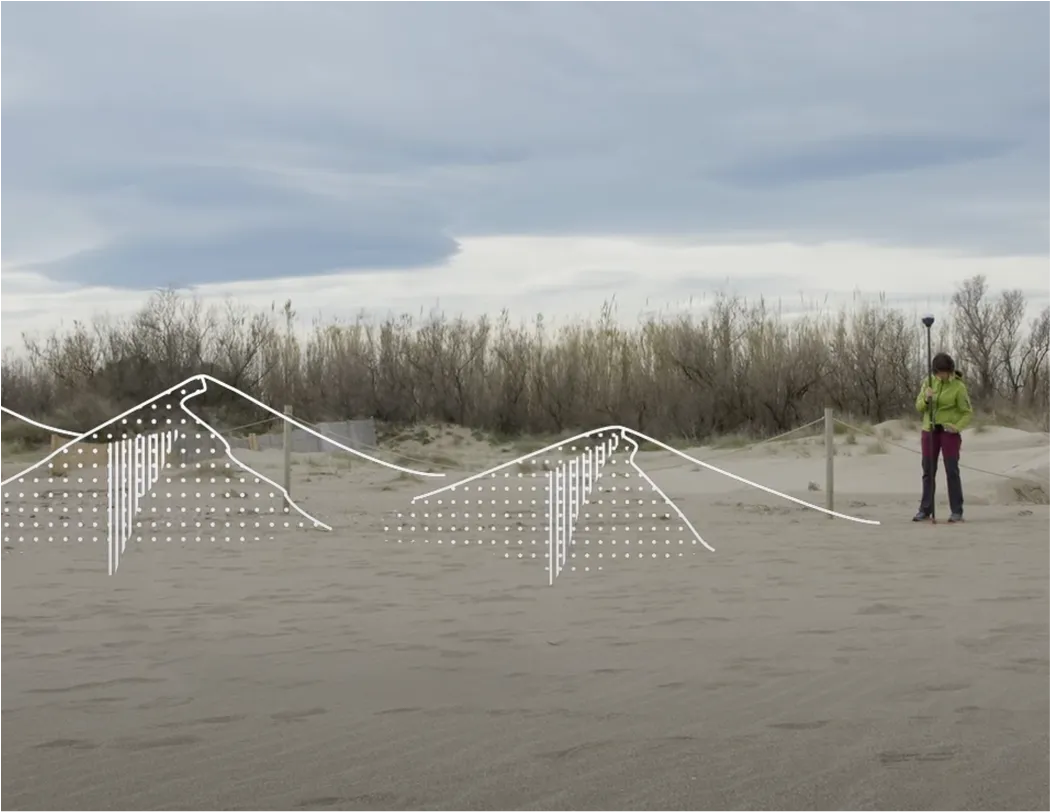
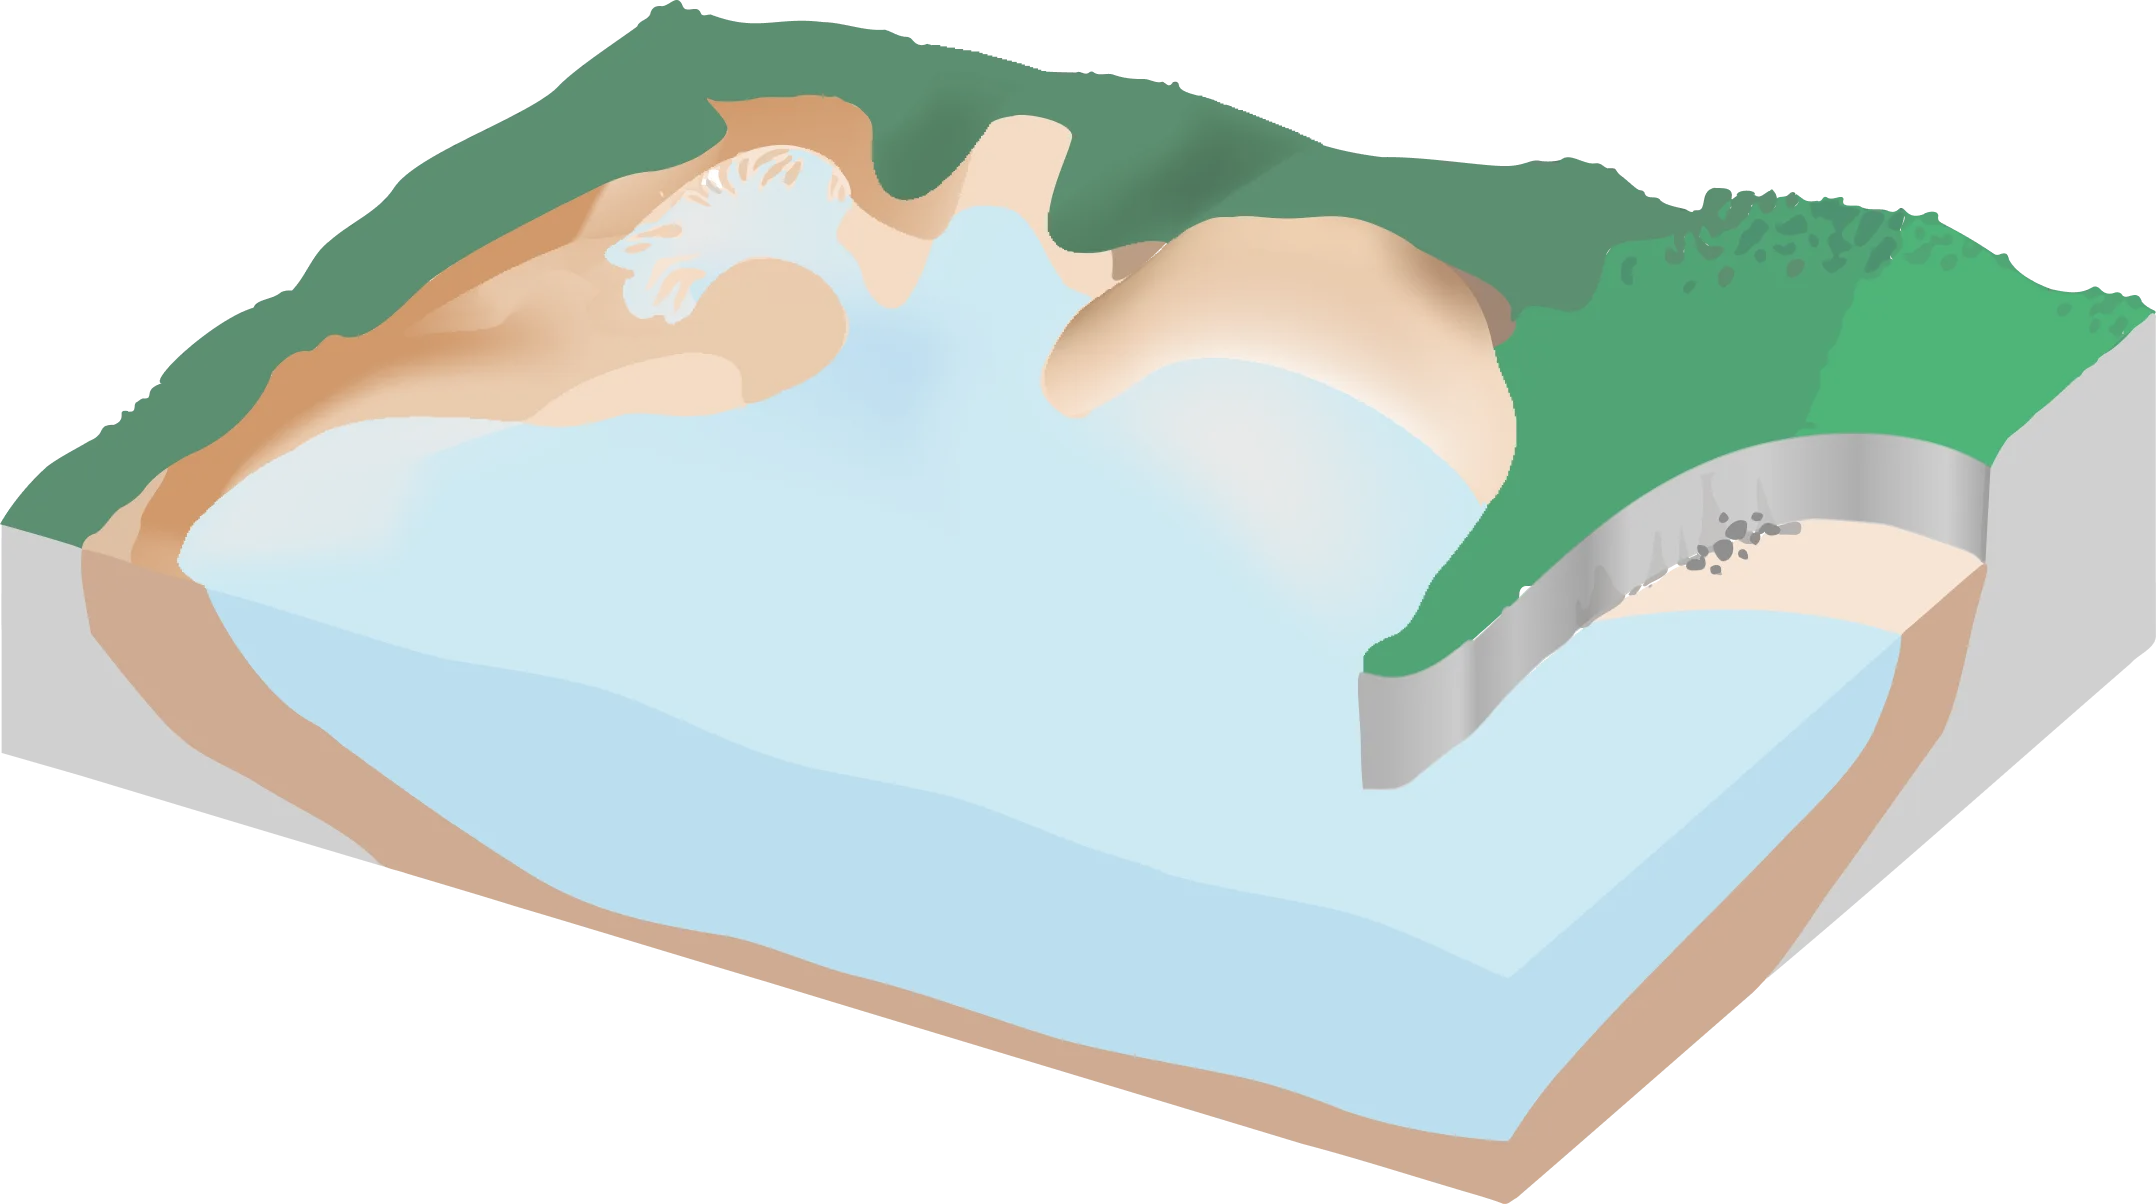
Dune erosion
What
The dune foot is the base of a sand dune, where the edge of a dune meets the more gently sloping edge of the beach. It is a valuable indicator for monitoring coastal erosion and dune health.
How
Using Sentinel 1 synthetic aperture radar (SAR), satellite data monitors changes in the dune foot.
Why
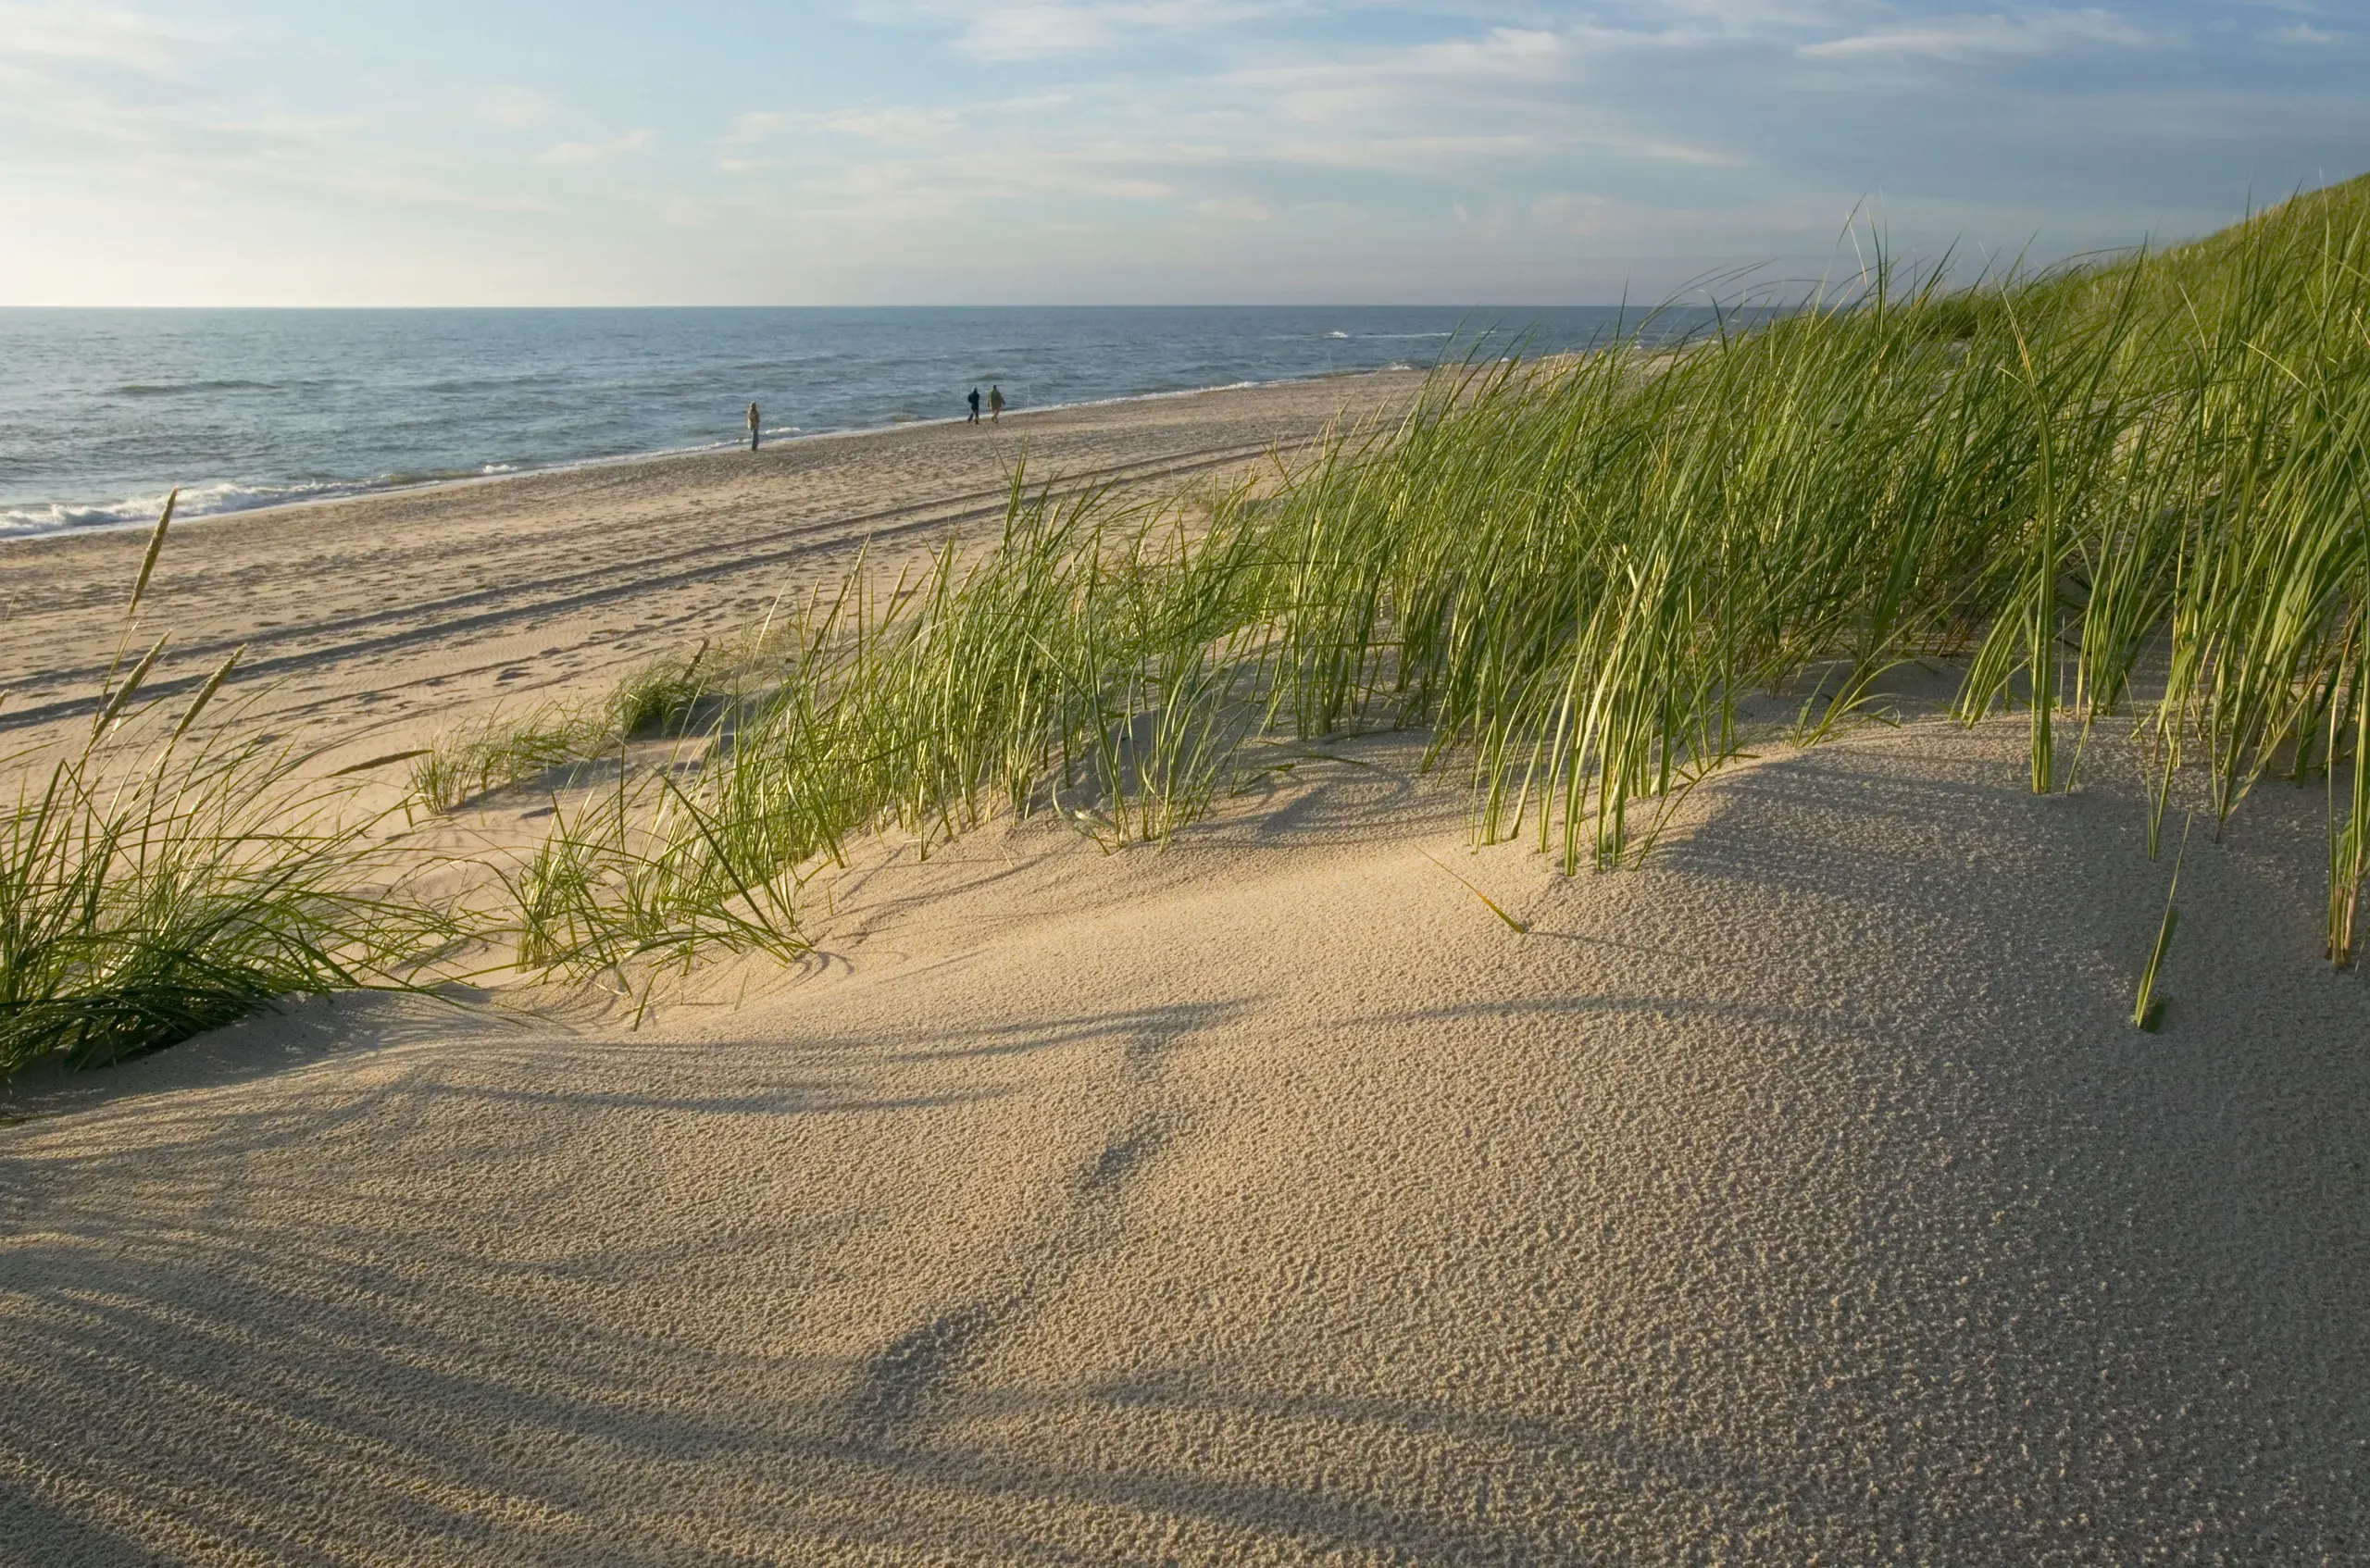
Coastal dunes are natural barriers against erosion, and as hosts to unique coastal species, they are also important indicators of ecosystem health.
Médoc, France
1988-2019
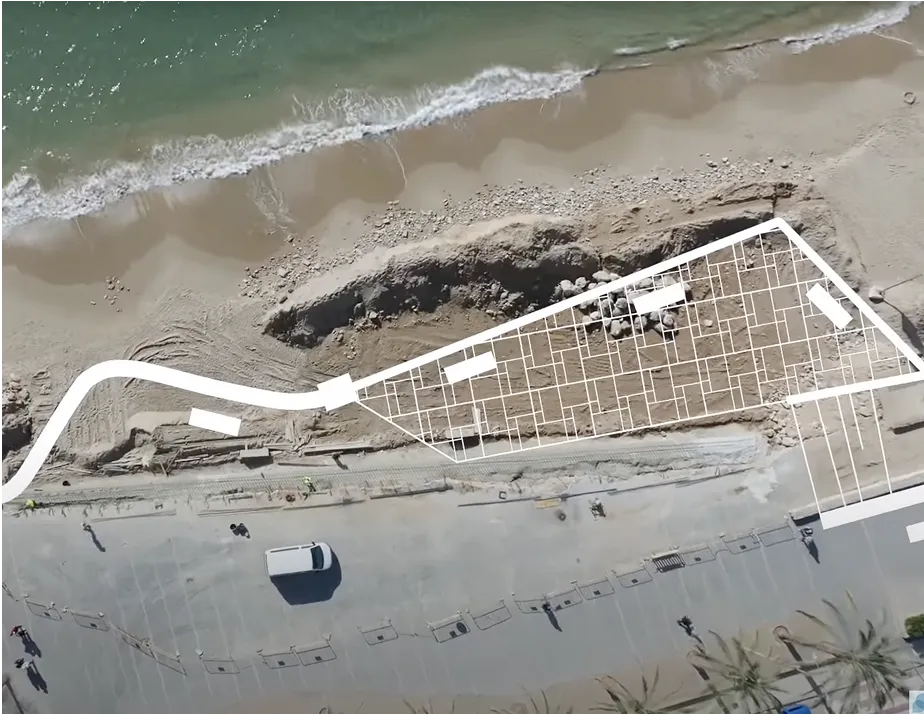
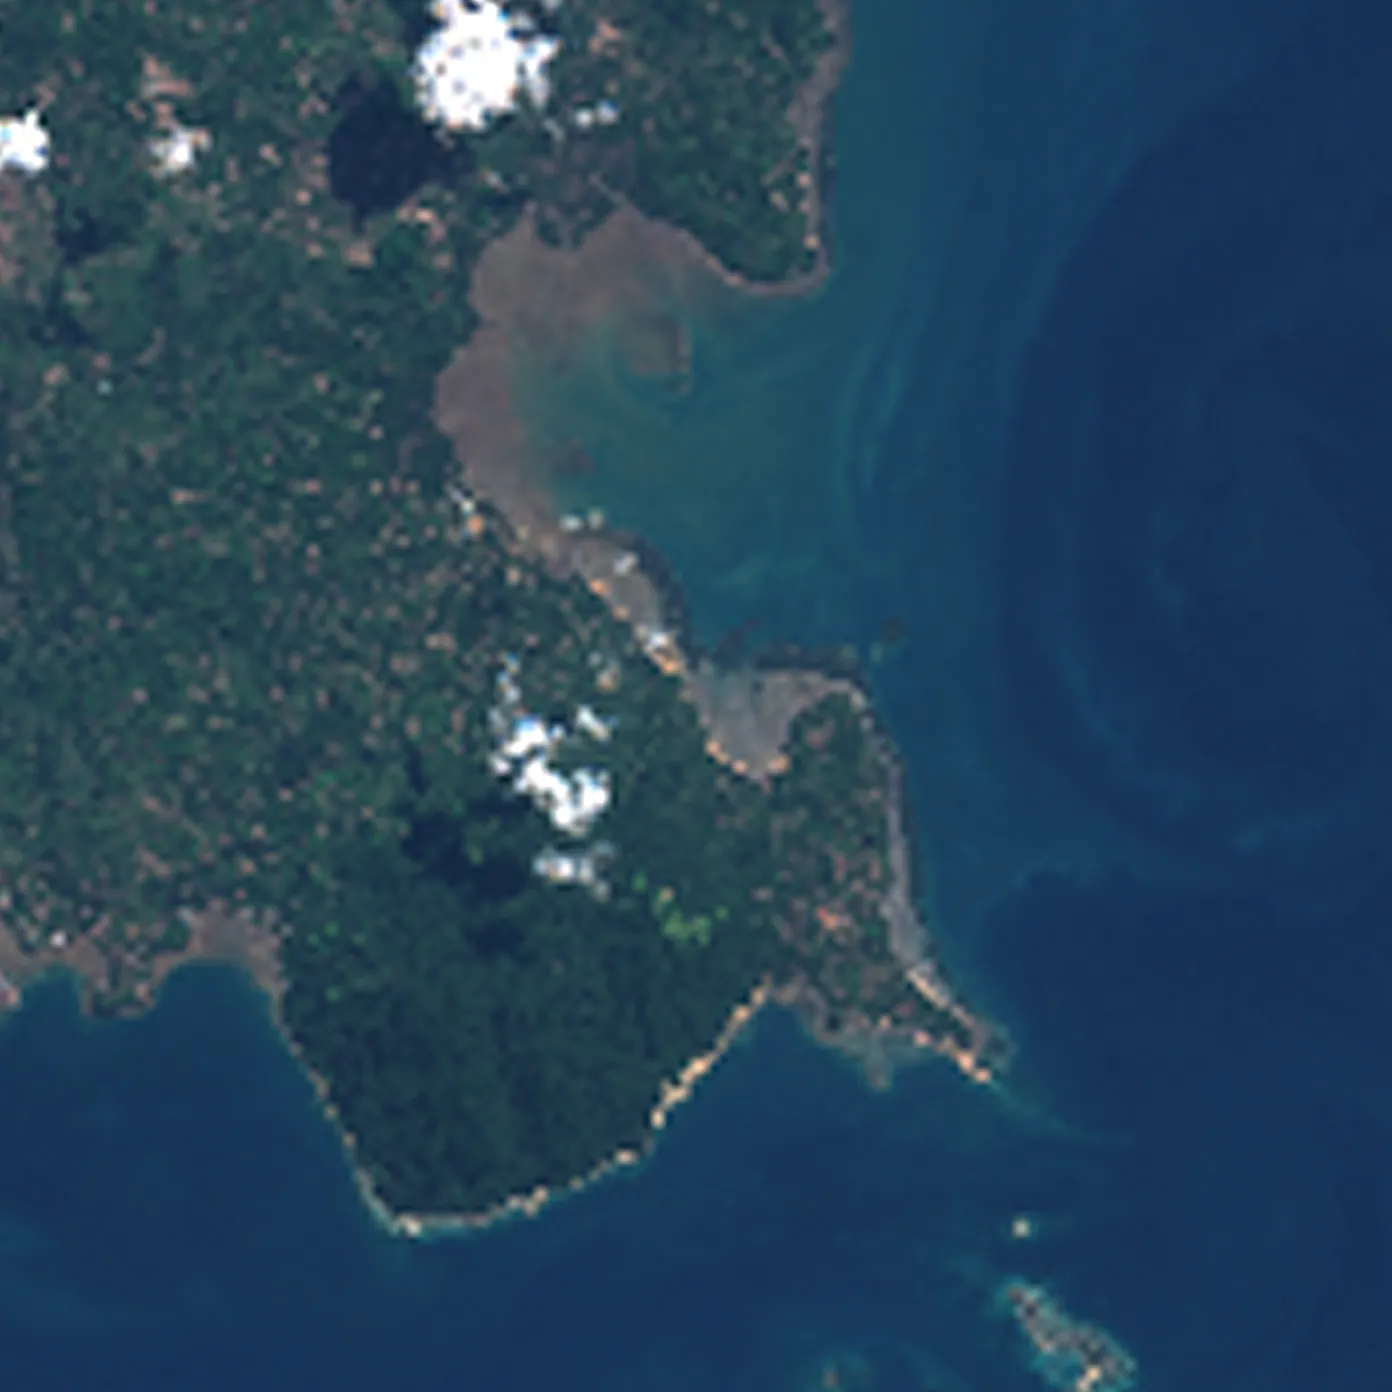
Shallow water sand displacements
What
Sand is continually shifting, and can be tracked in the shallow waters along the coast.
How
Using multi-spectral imagery, satellites measure sand displacement and bathymetry, the underwater landscape.
Why
Studying shallow water sand movement reveals how it changes. It also predicts whether lost beach sand is permanent or will return the next season.
NosyBe,
Madagascar
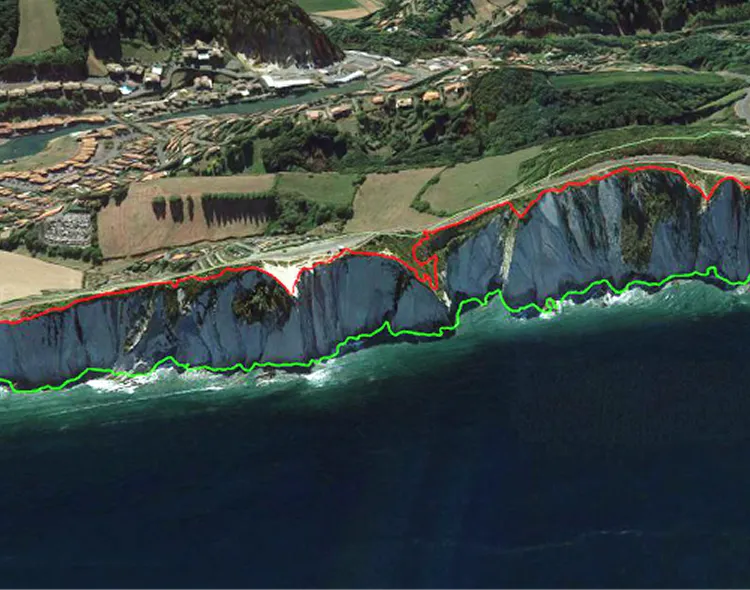
Cliff landslides
What
Cliffs lose sediment gradually at their base as water slowly erodes layers away until suddenly larger blocks break away from the top when the cliff is no longer supported.
How
In landslide prone areas, Sentinel 1 SAR can monitor both the base and the top of the cliff.
Why
This helps land managers predict when the cliff is becoming destabilised, and is at higher risk of cliff collapse.
Pyrénées-Atlantiques,
France
Cliff lines
Using satellites to map the ocean has other key benefits:

Efficient
Large areas are regularly covered, allowing for systematic monitoring over multiple time periods.

Scalable
Monitor coastlines at multiple scales, from global assessments to detailed regional or local studies.

Cost effective
Compared to drones, satellite data is less expensive and scalable at very low cost.

Does not require fieldwork
Especially for remote hard-to-reach places, Reduces the need for frequent field visits, and expensive surveys.
Tapping into insights with historical data
Besides satellites, there are a number of other tools, including drones, aerial images, or camera recordings that can be used to monitor coastal erosion. Each of them serve different purposes to effectively manage our coastlines. A special advantage of satellite data is the historical perspective it provides together with its temporal and spatial resolution. Whereas other tools show a snapshot of time and provide excellent validation data, satellite imagery is continuous and captures the many different cadences of erosion throughout time.
As an example, perfectly flat beaches cleaned by machine are favoured in some regions to please tourists, but this practice accelerates erosion by removing vegetation, resulting in the entire loss of the beach and economic repercussions for coastal communities. Alternatively, manual clean up of beaches leaves natural elements that trap sand and minimize erosion.
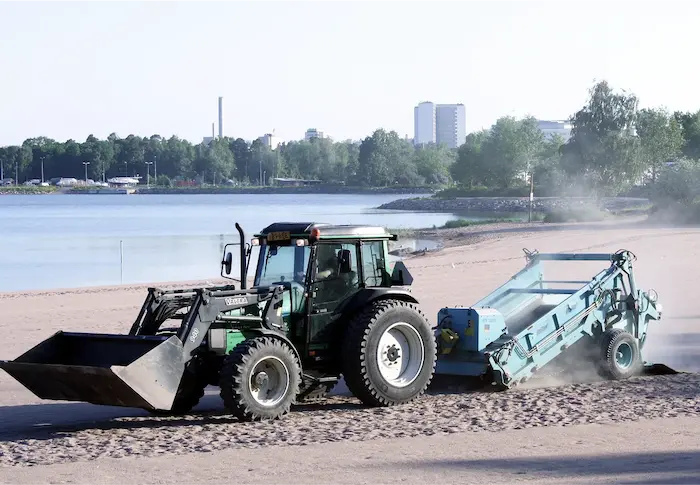
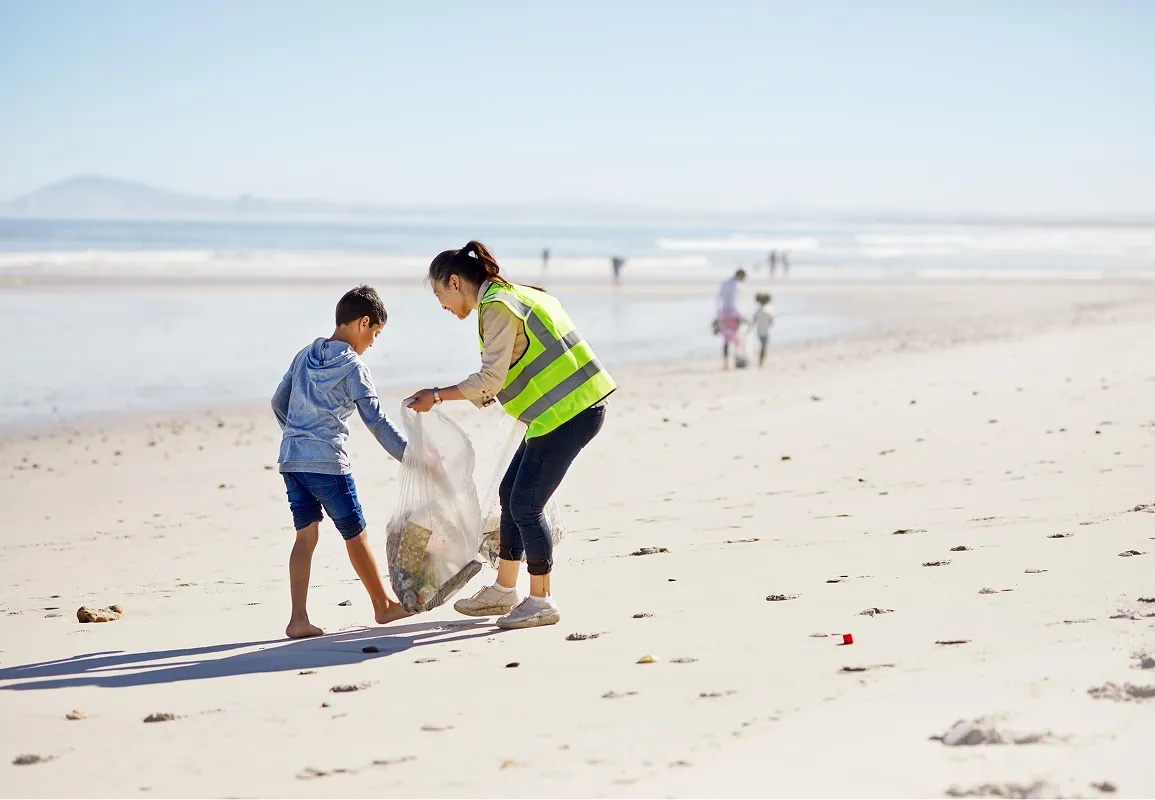
By using satellite data, the effects of different cleaning methods can be retrospectively compared, providing evidence that manually cleaned beaches have lower rates of coastal erosion. In the long term, a more resilient beach with a slower rate of erosion is better for tourism and better for the environment.
Shaping future decisions
Coastlines are retreating, yet adaptation measures can be socially and economically disruptive, making them difficult to adopt.
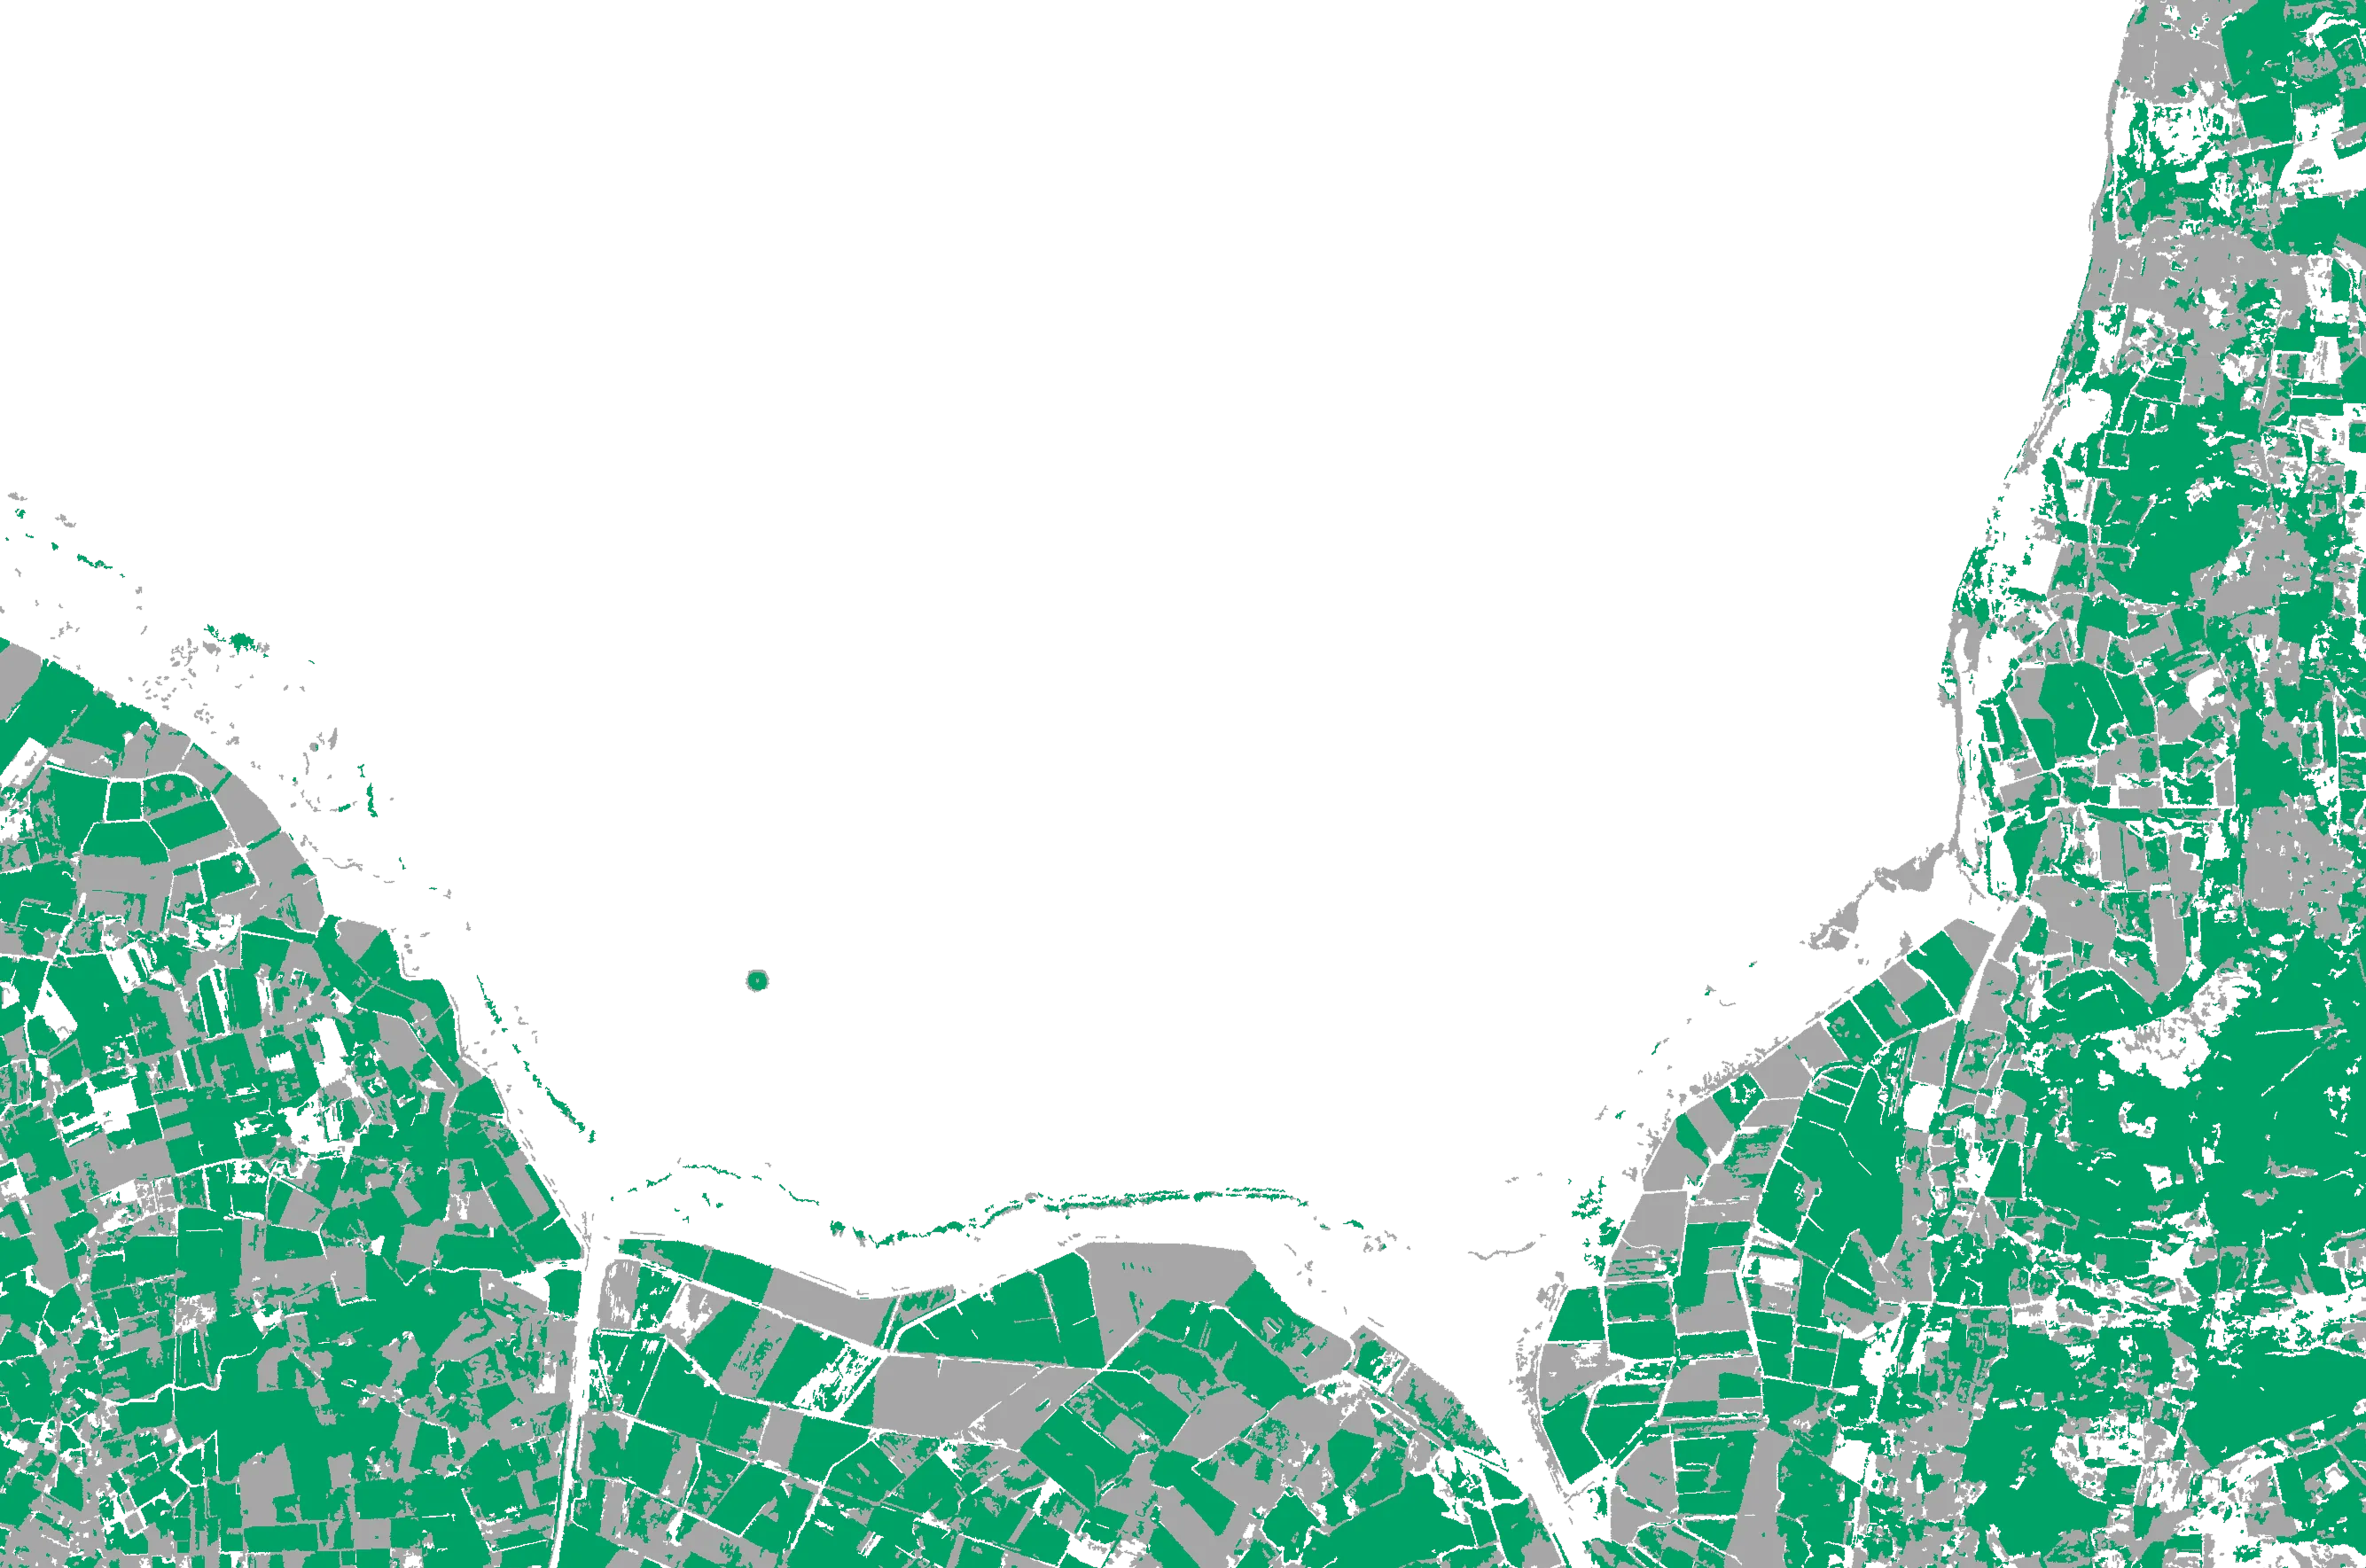
For climate adaptation planning of the coast, satellite-derived land use land cover classification maps can help decision makers anticipate the kilometers of coast at risk on local and national scales. Coastal infrastructure surrounded by natural barriers such as mangroves, salt marshes, or vegetated dunes is more protected from erosion, whereas unprotected shoreline infrastructure is at high risk of erosion impacts.
An example of a well-protected estuary at the mouth of the River Welland in The Wash, England.
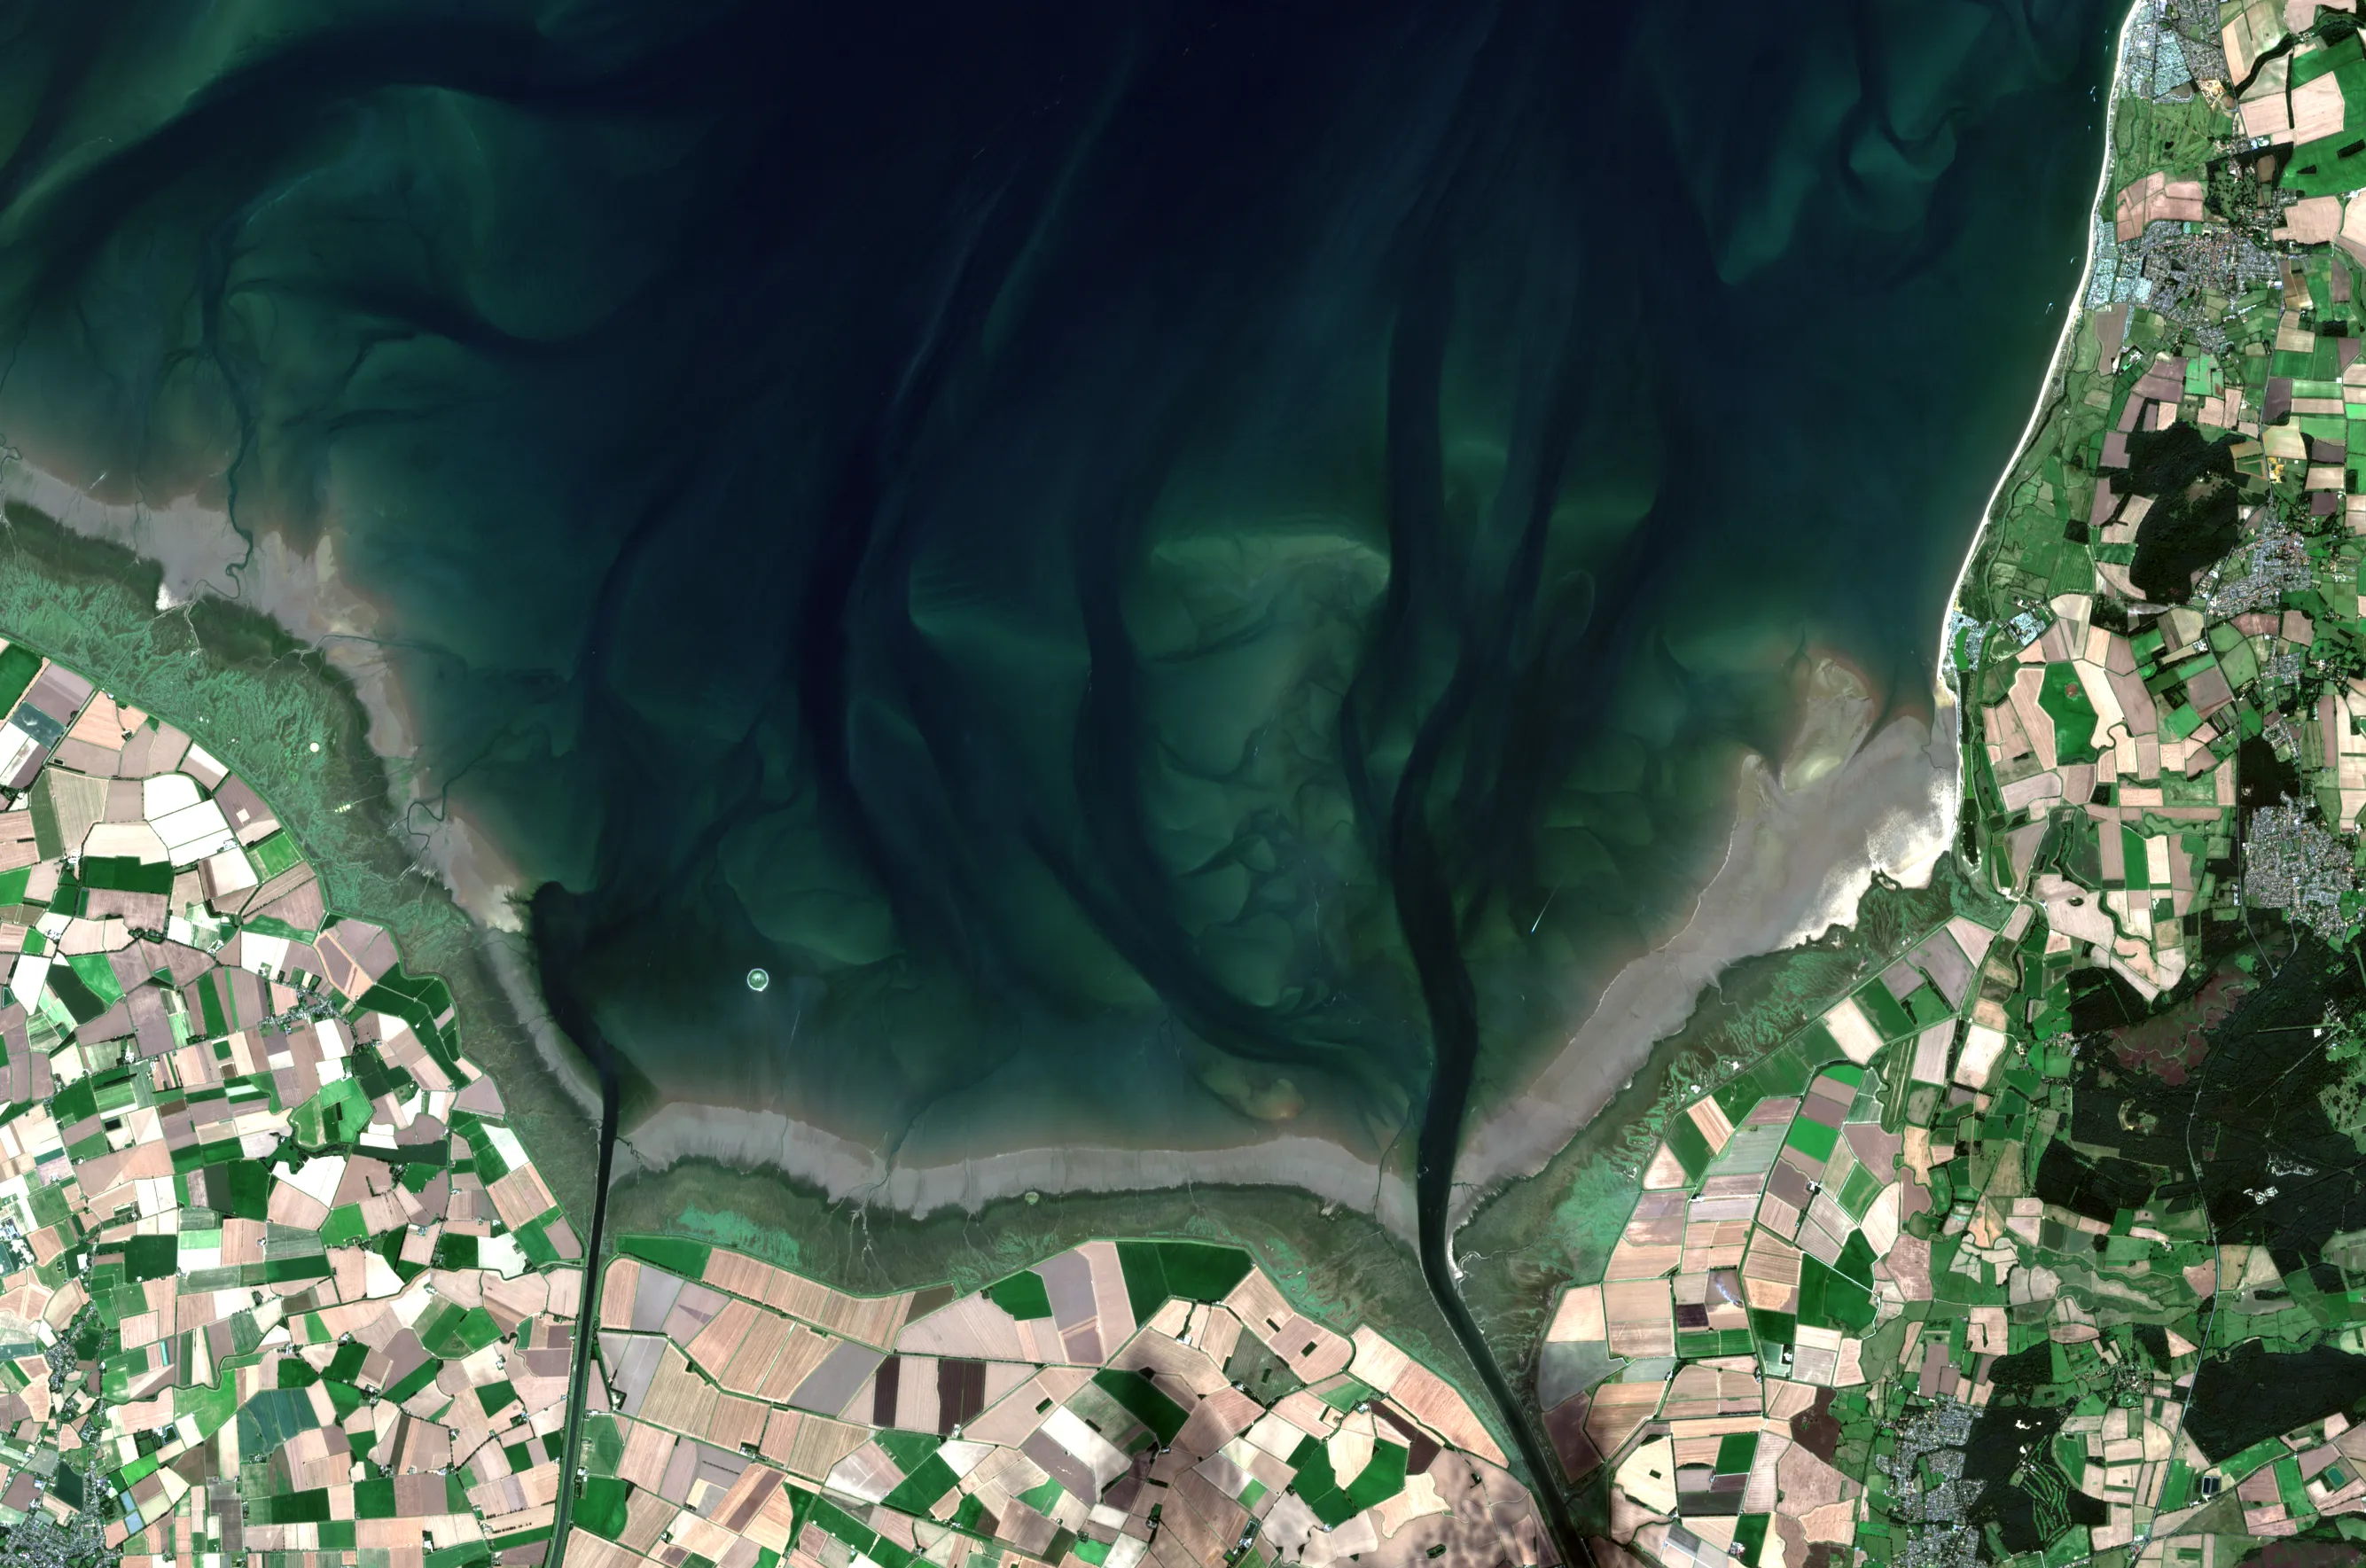
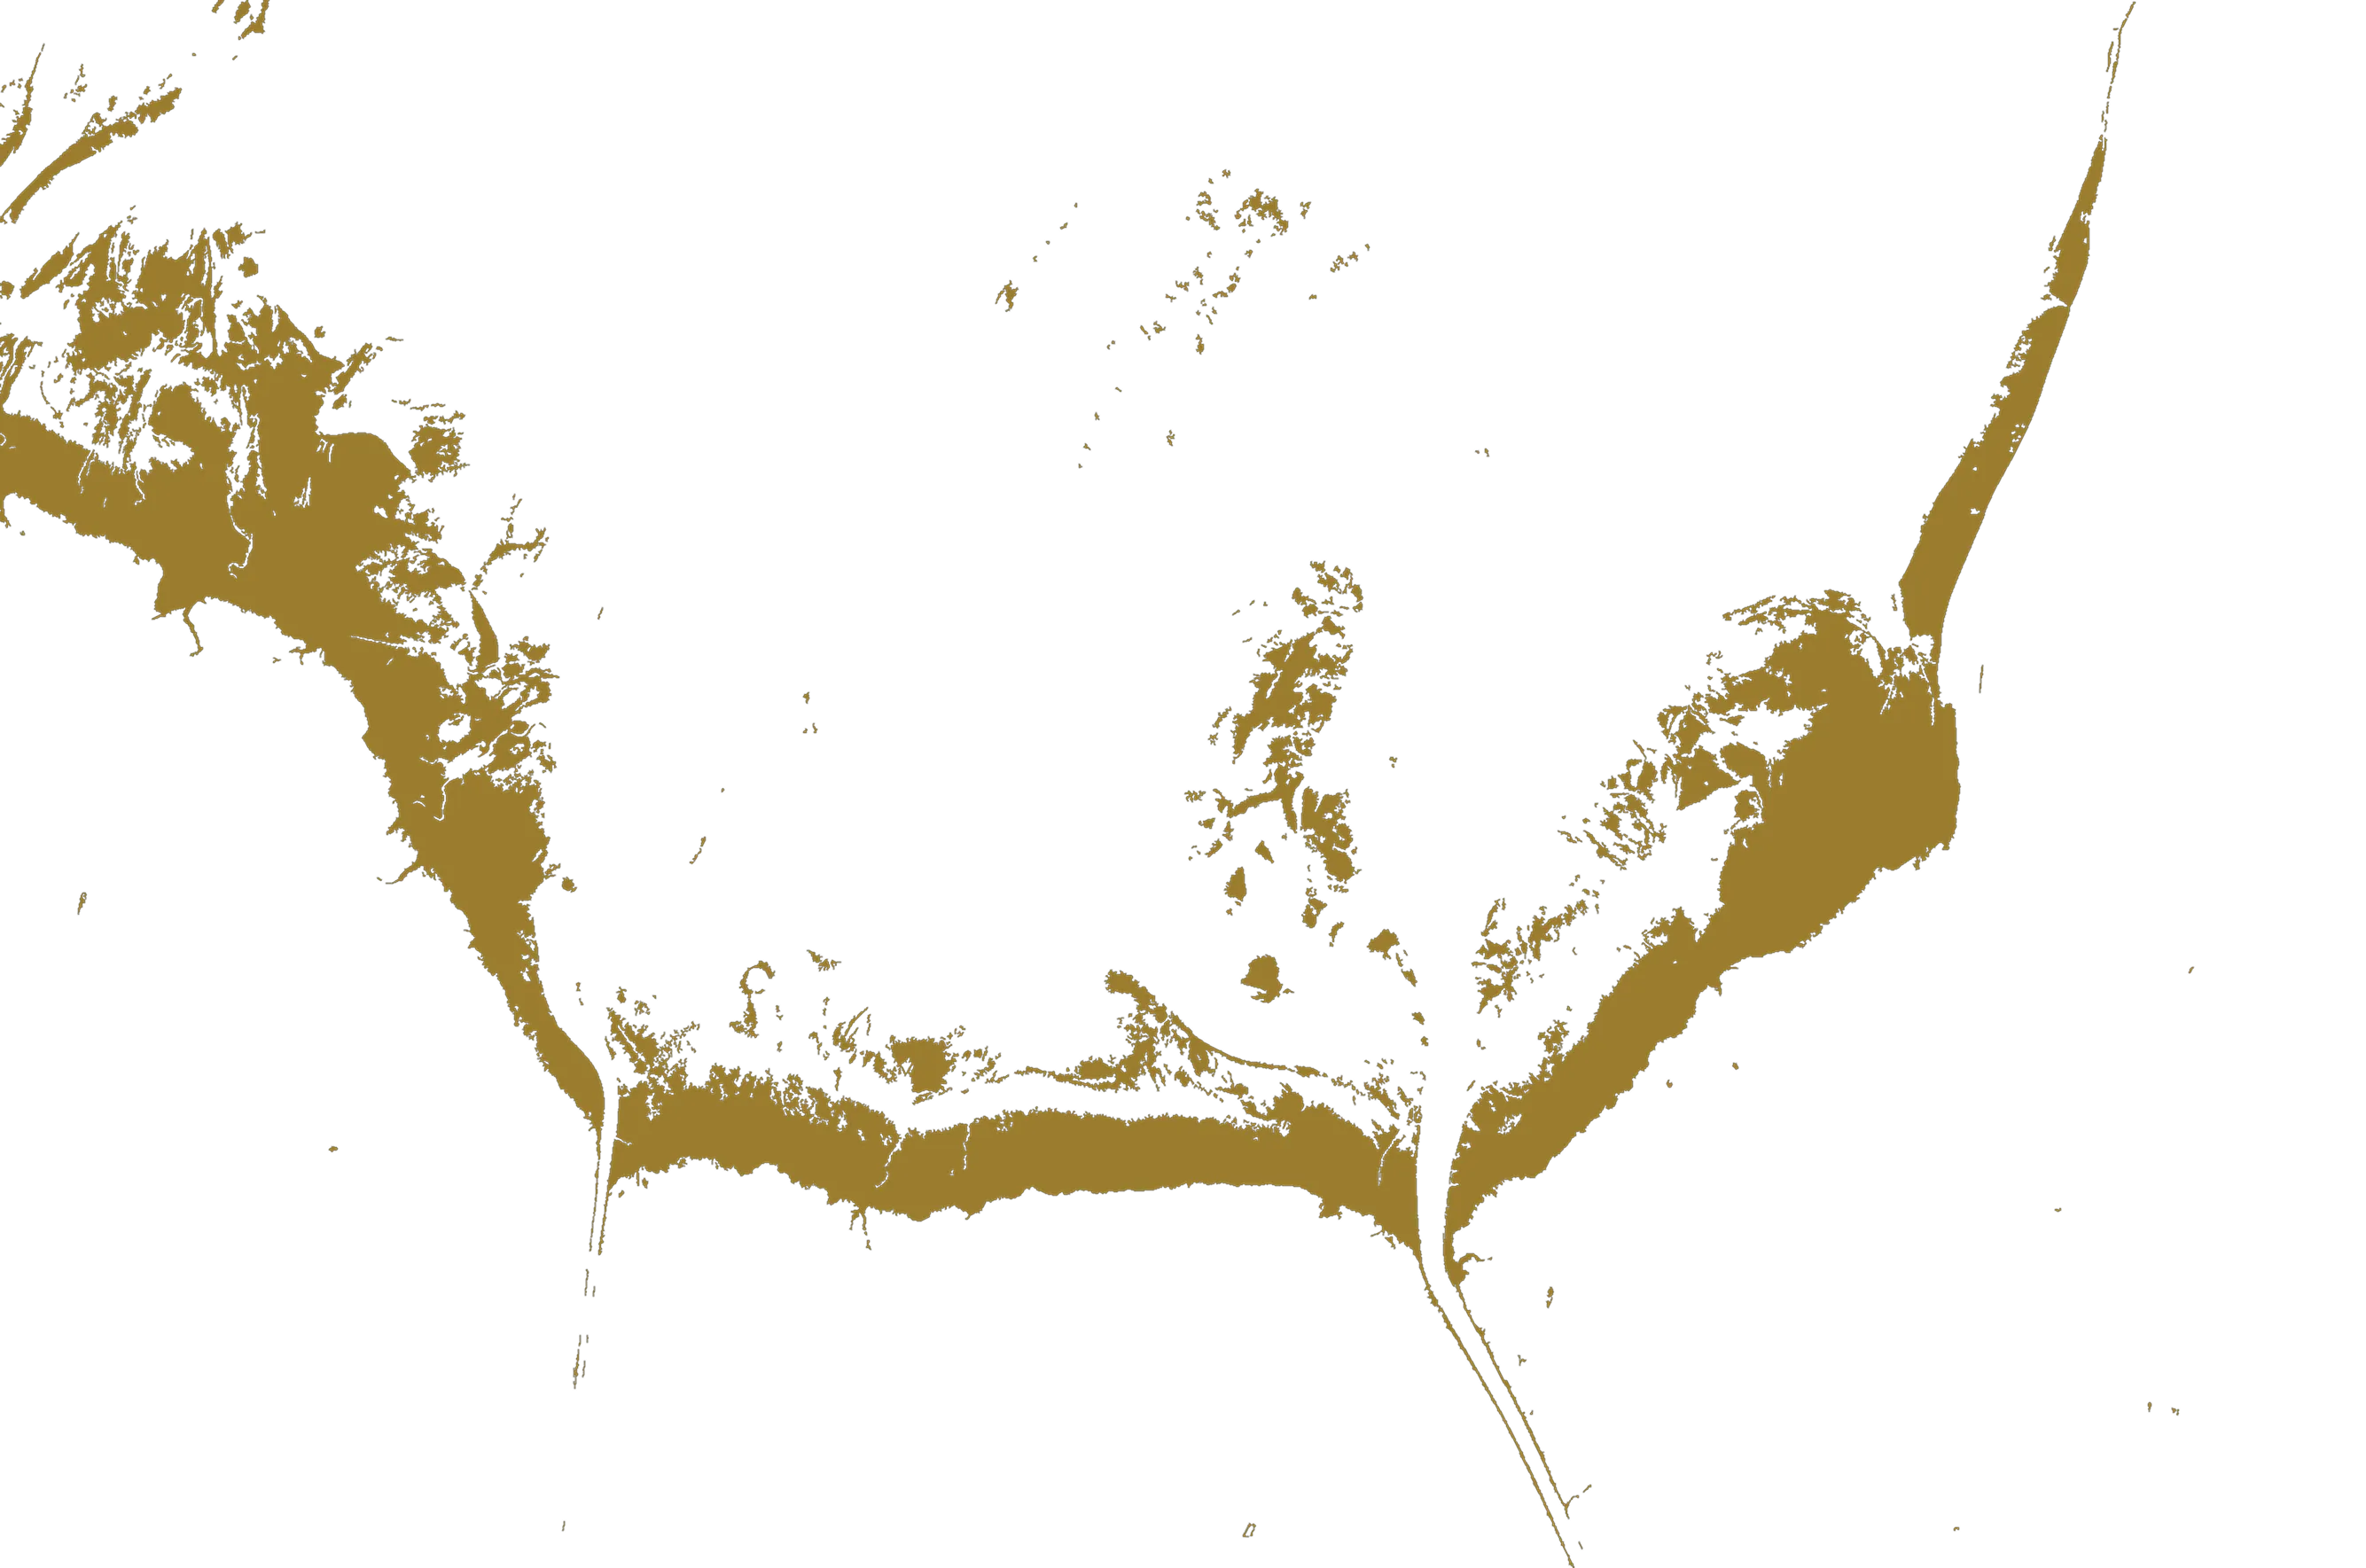
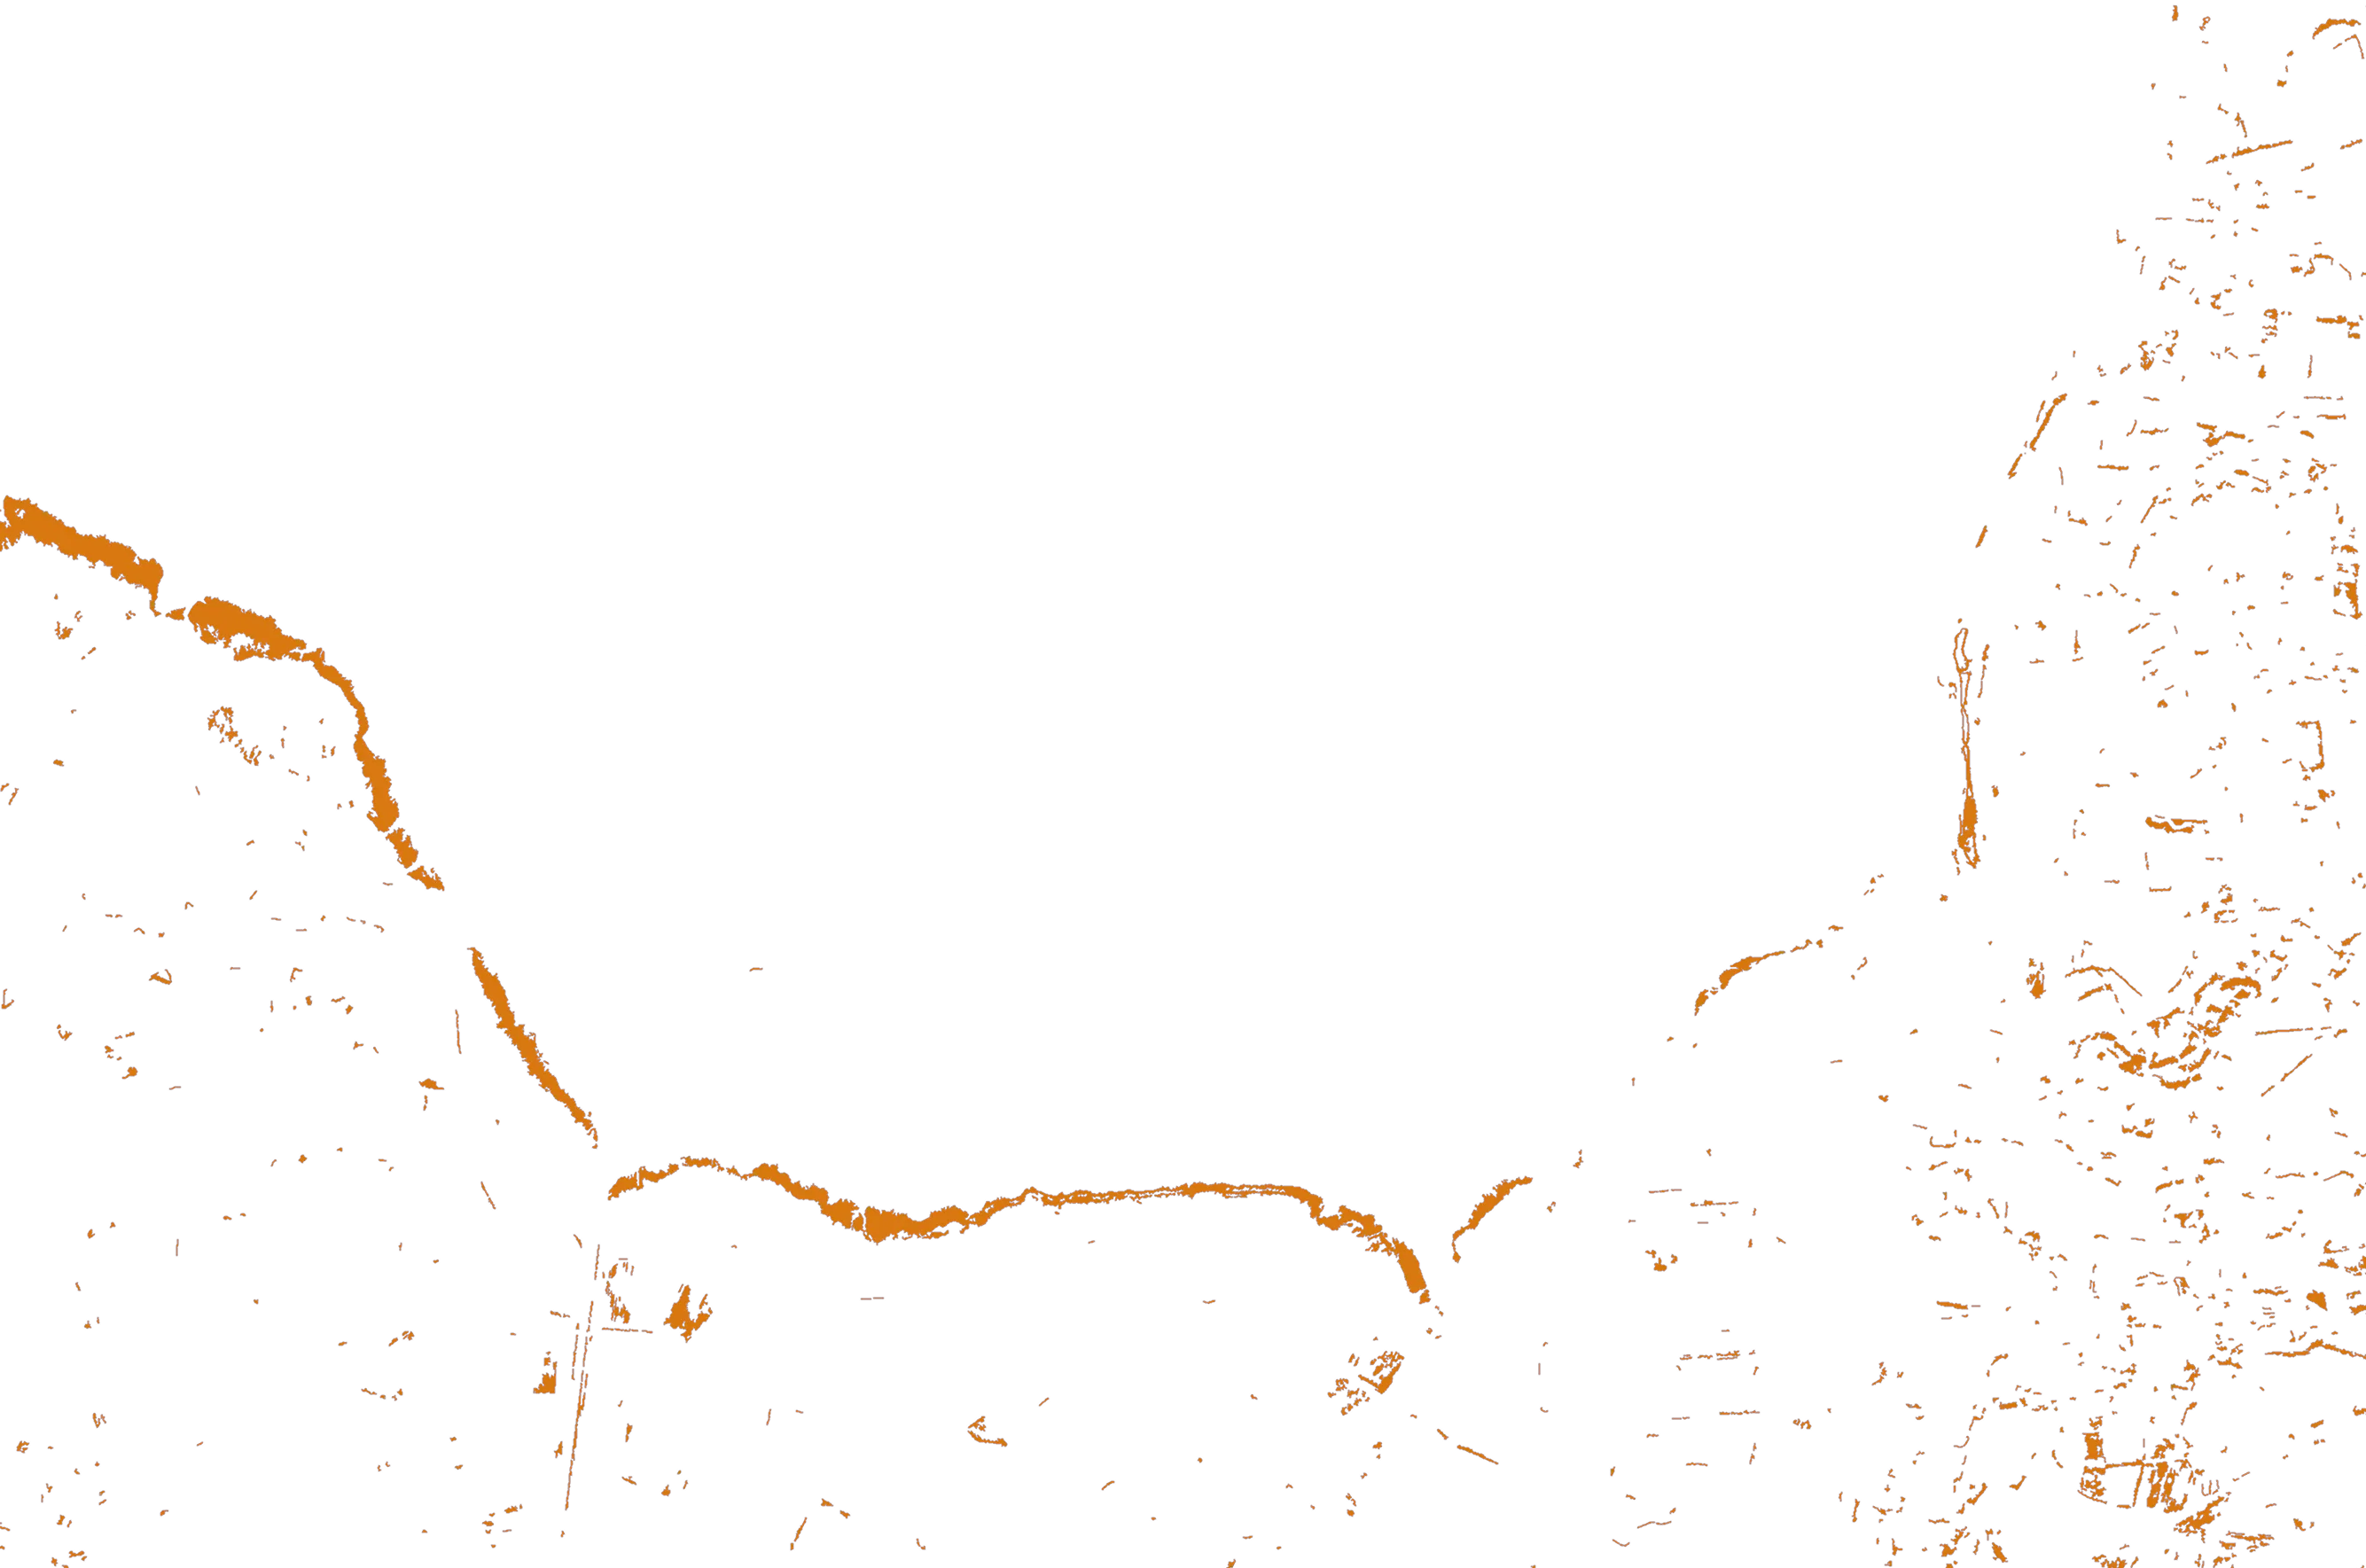
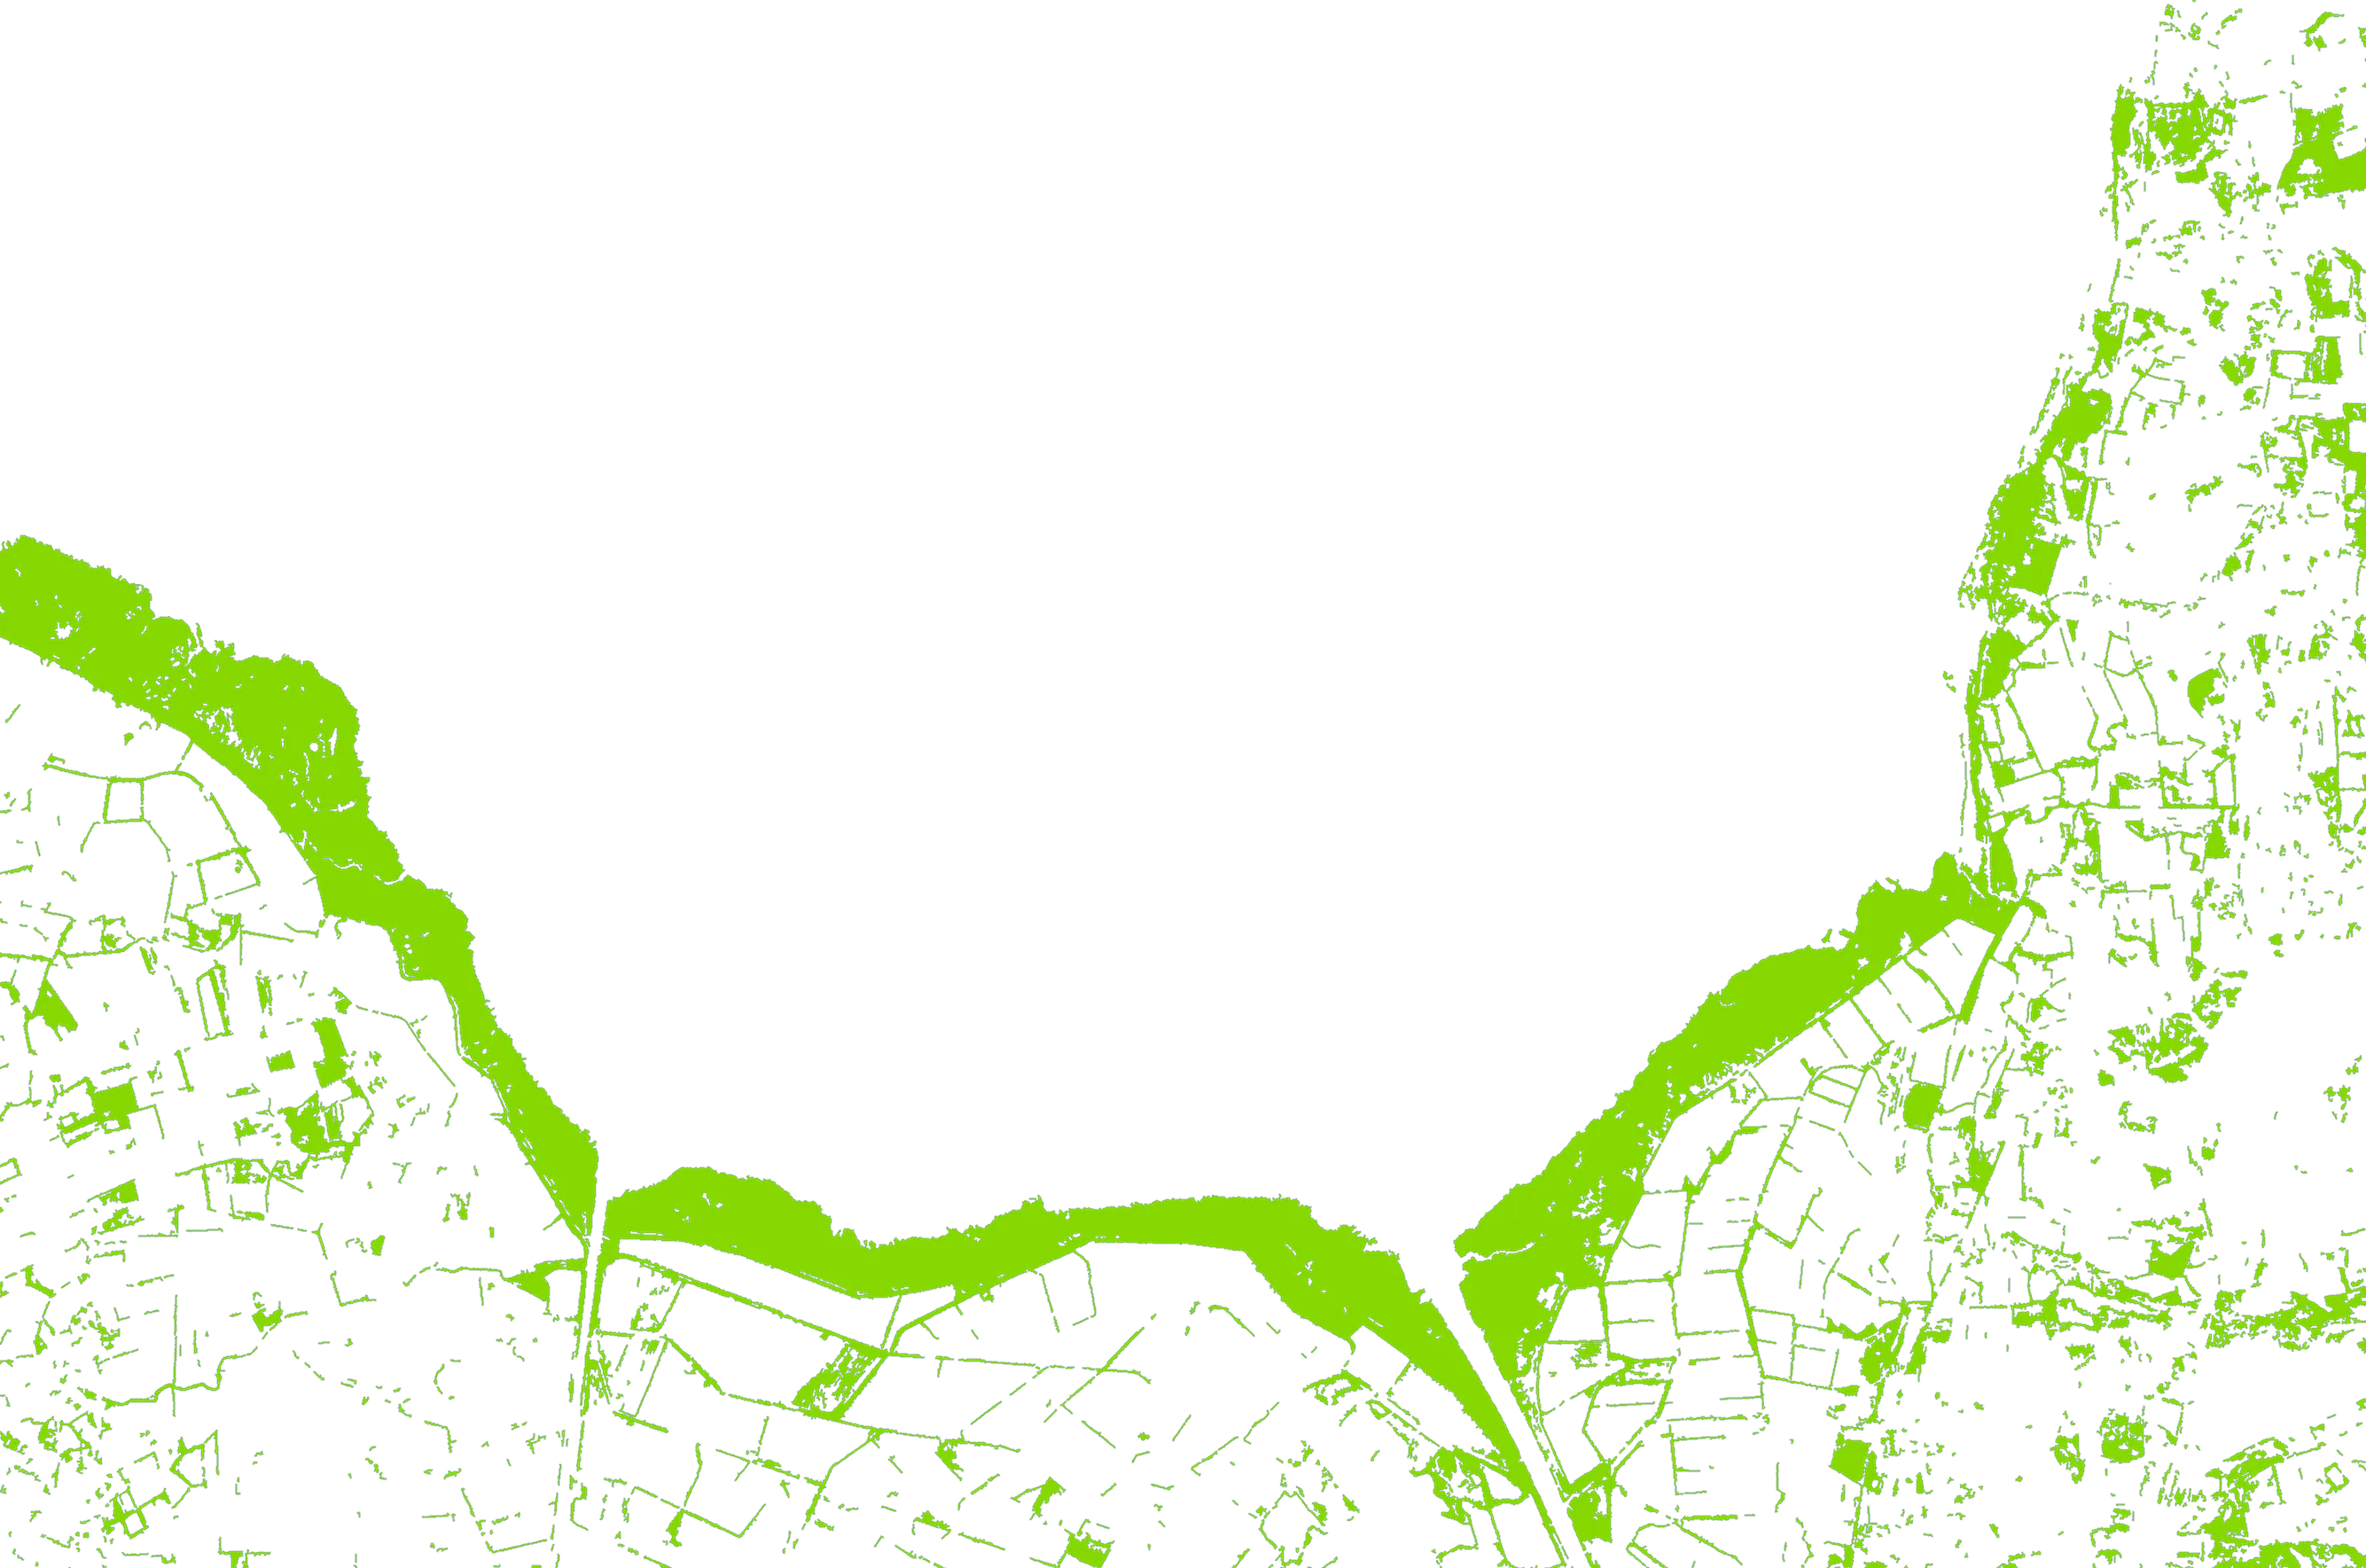
This is a well-protected area at the mouth of the River Nene and River Great Ouse in The Wash, England, during high tide.
By using satellite imagery we can distinguish between the sea, and the crops and built up areas during low tide.
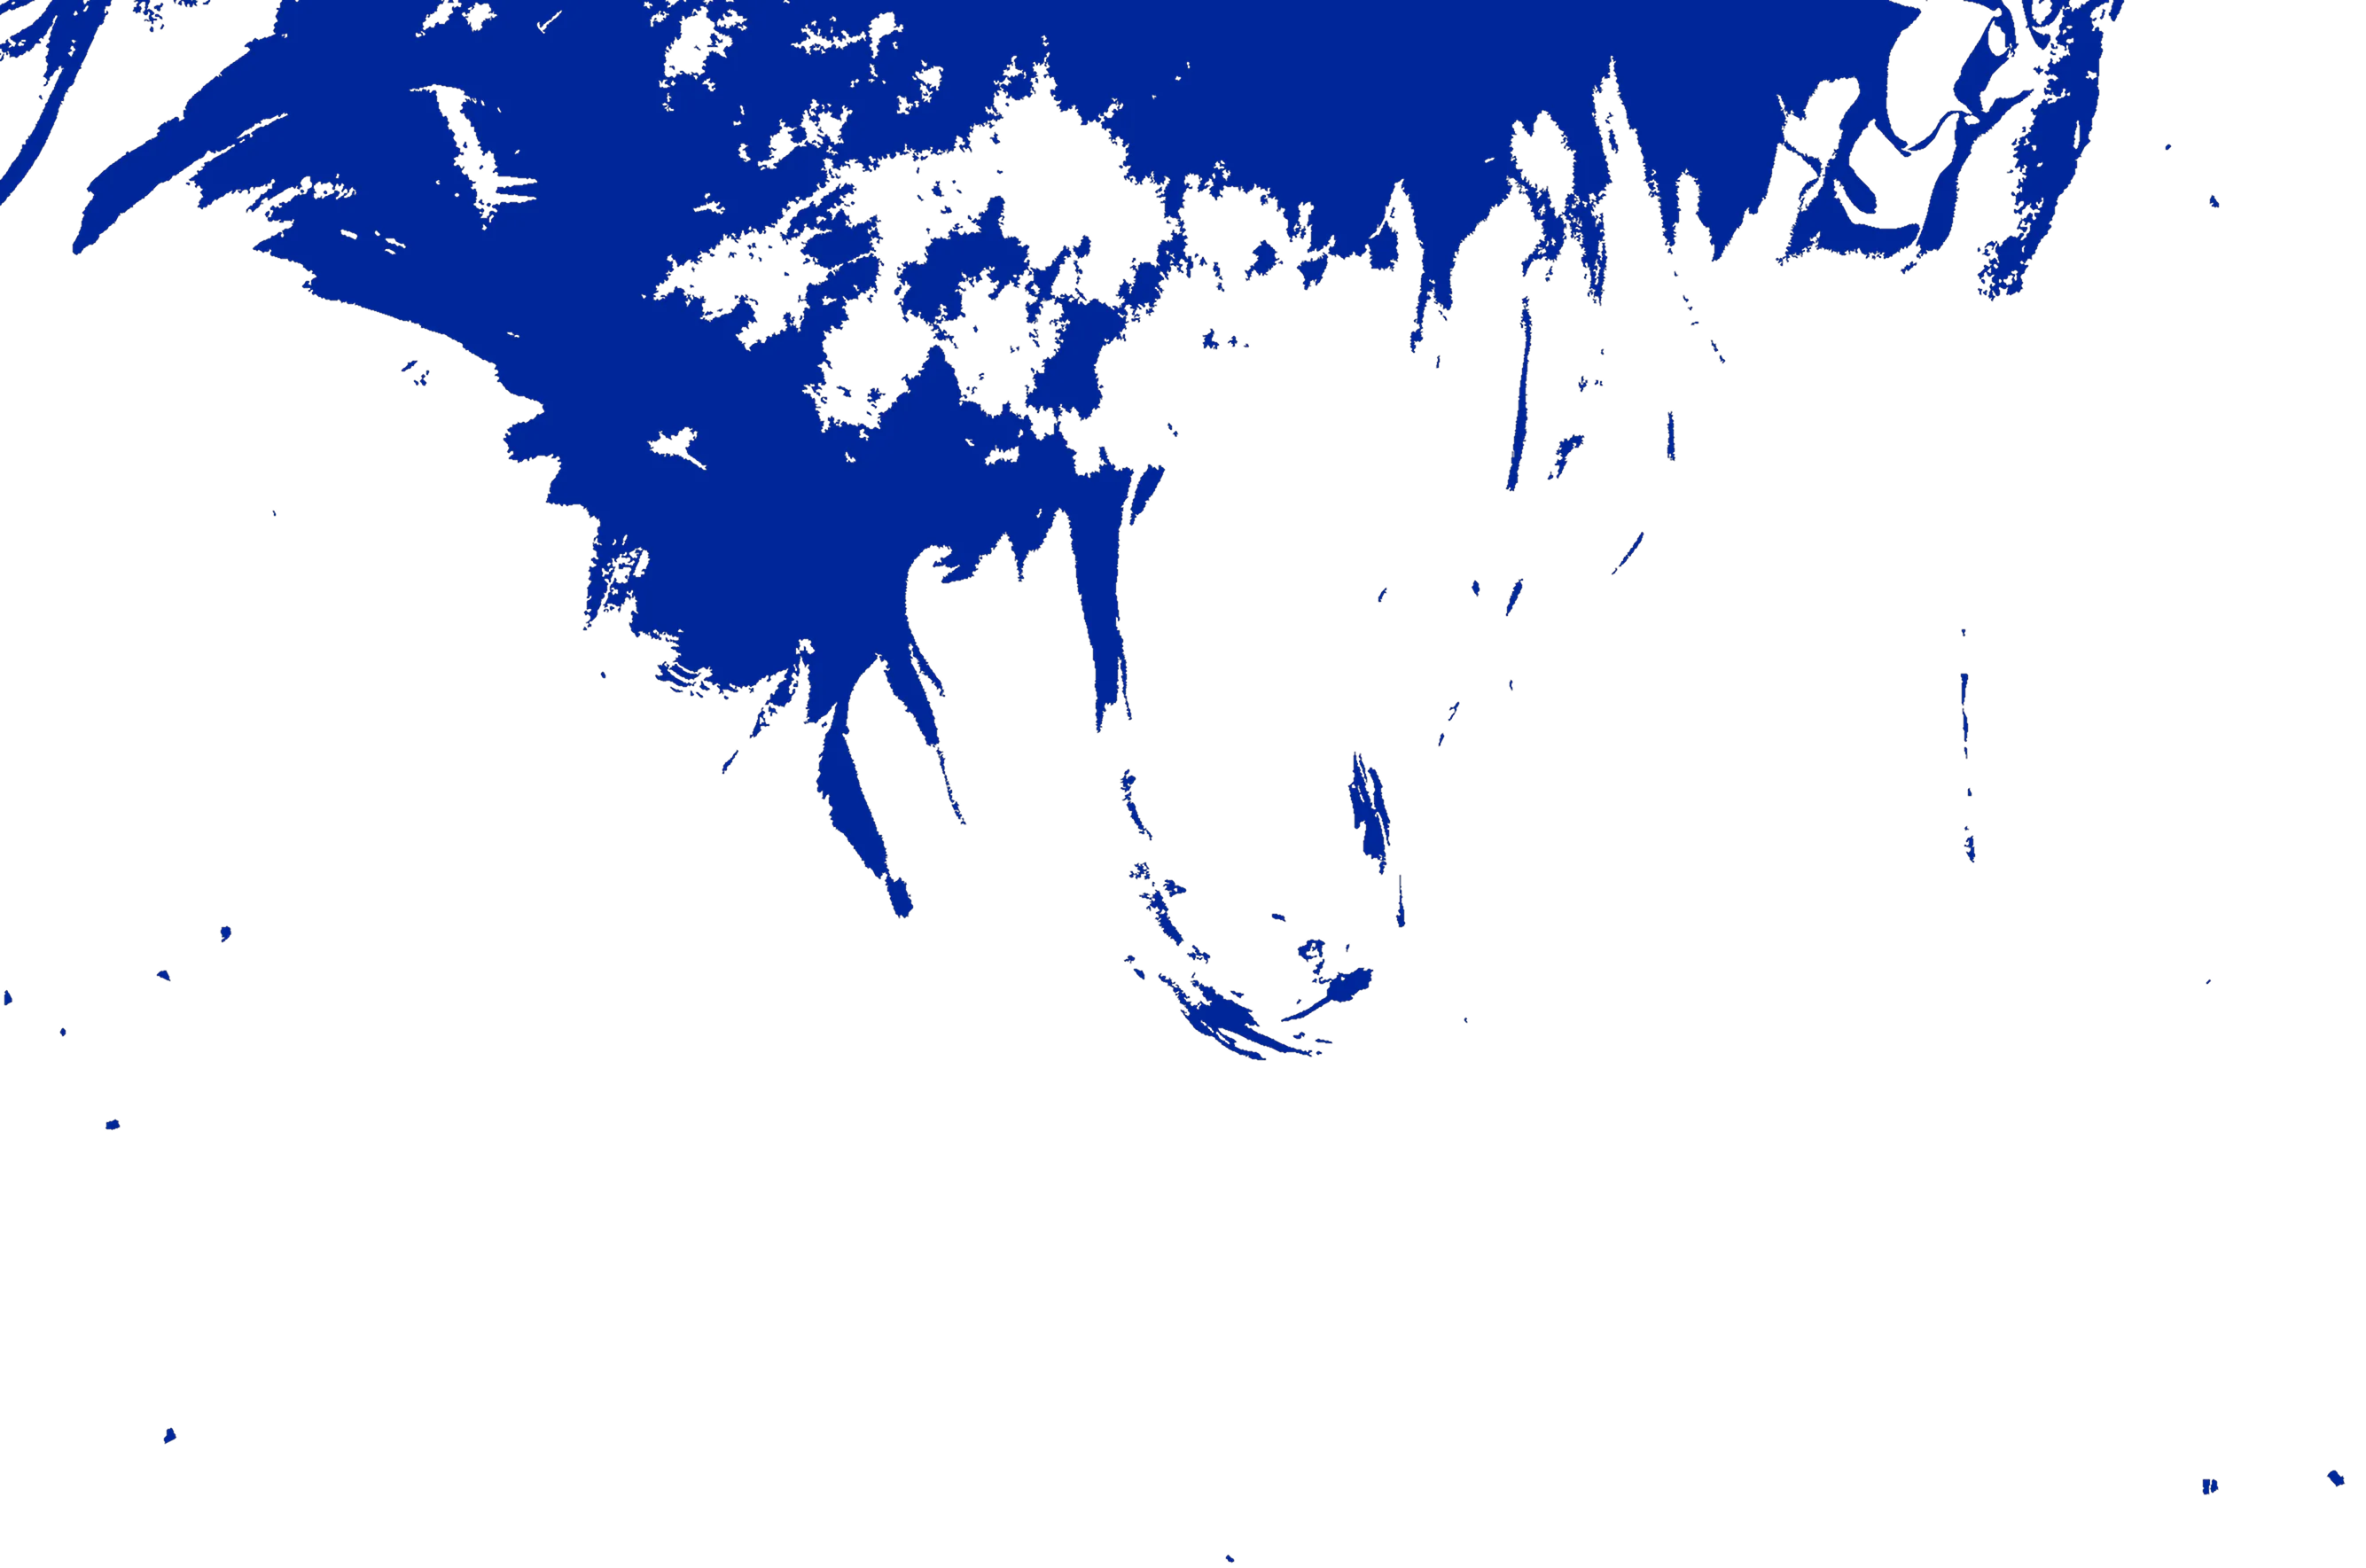
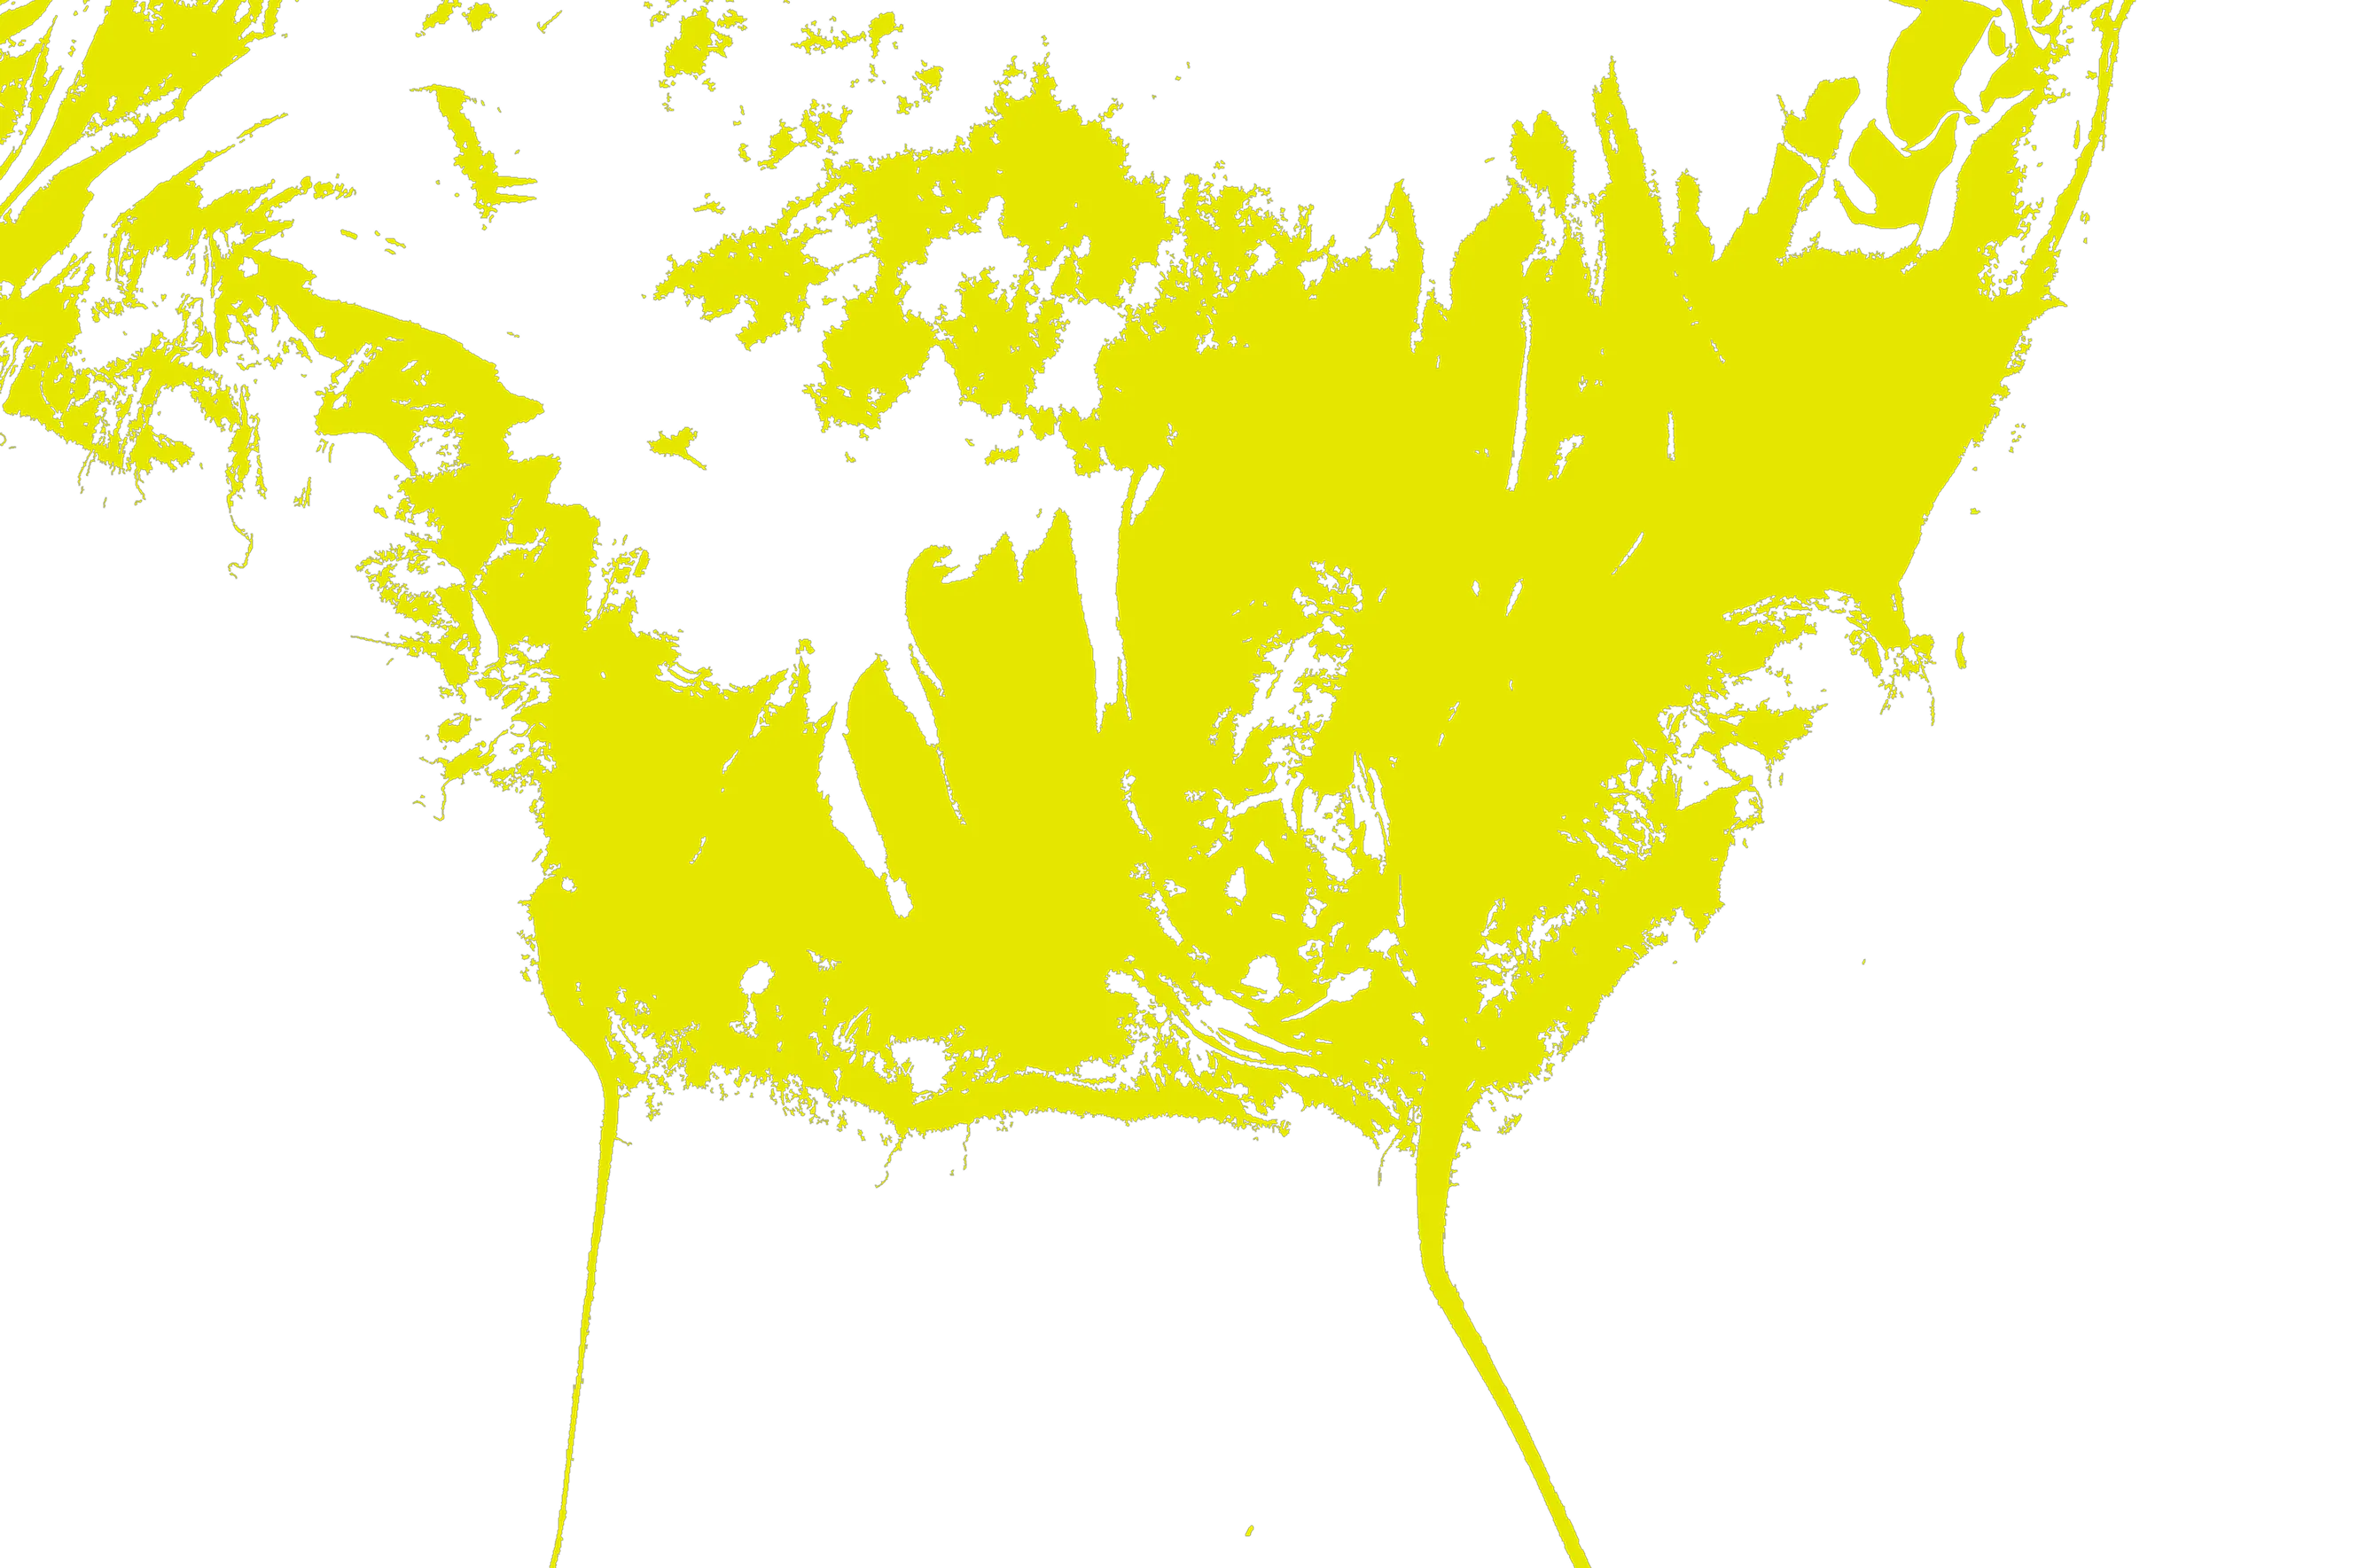
Scroll to discover the different natural barriers that guard the coastline against erosion from the sea by clicking on the legend labels
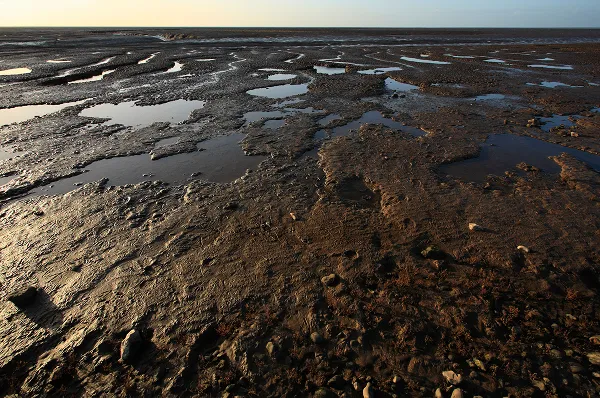
Tidal areas are underwater during high tides and emerge during low tides. These areas help to dissipate the energy of the waves as they extend into the ocean over a wide distance.
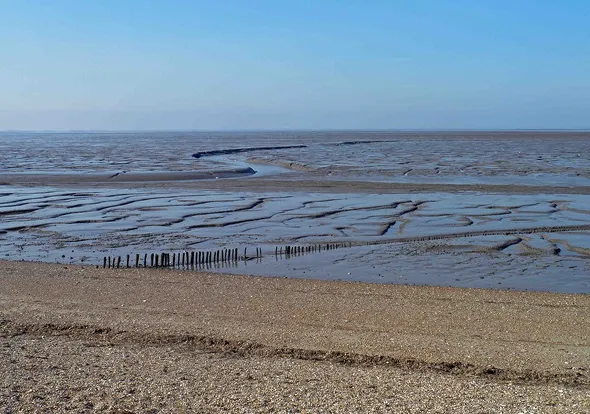
Mudflats absorb wave energy before it hits the coastline, and are home to a thriving ecosystem of invertebrates.
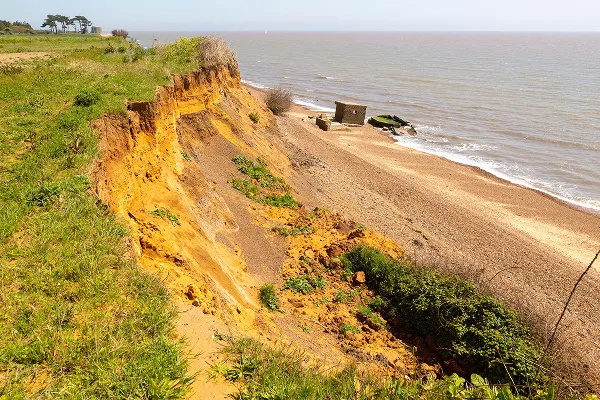
Soft cliffs are vulnerable to erosion, but are stabilised by other barriers, such as mudflats, and vegetation.
Salt marshes buffer wave action and trap soil to protect the coastline. They are also essential nursery habitats for fisheries species, including shrimp, blue crab, and many fish.
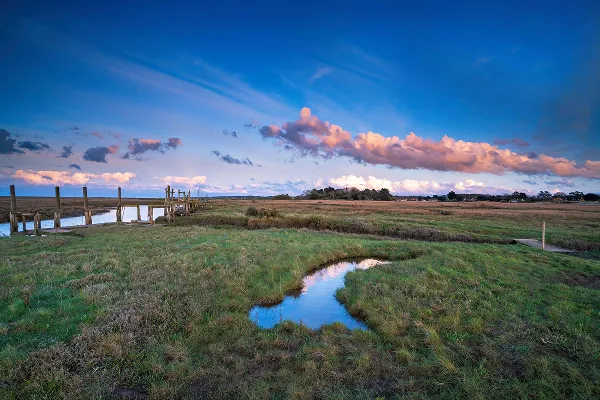
Those natural barriers are:
By enhancing evidence-based decision-making, satellite data accelerates adaptation and strengthens coastal protection for both nature and people.
In low- and middle-income countries, limited resources often hinder effective preparedness and adaptation. Satellite monitoring provides critical data to protect vulnerable coastal communities, supporting resilience, risk management, and sustainable development worldwide.
The European Commission and ESA are committed to long-term data acquisition, enabling continuous monitoring of coastal changes and assessing the effectiveness of strategies to preserve dynamic coastal landscapes.
About
The production of this interactive story has been possible thanks to the efforts of Lobelia with the support of the Space for Shore project, coordinated by i-Sea, and the Coastal Change form Space project, coordinated by Argans. This story has been prepared under ESA EO Science for Society funding in the context of the ESA project Edukeo.
References
- Lobelia, 2025. Global map of coastal cities Data includes populated settlements with over 100 thousand inhabitants in 2010 that are 100 kilometers or less from the coast and at an elevation of no more than 250 meters. Population data was sourced from Natural Earth and elevation data was sourced from Copernicus' GLO-30
- Fyfe, J.; Fox-Kemper, B.; Kopp, R.; Garner, G. (2021): Summary for Policymakers of the Working Group I Contribution to the IPCC Sixth Assessment Report - data for Figure SPM.8 (v20210809). NERC EDS Centre for Environmental Data Analysis, 2025. doi:10.5285/98af2184e13e4b91893ab72f301790db.
- IPCC, 2021: Summary for Policymakers. In: Climate Change 2021: The Physical Science Basis. Contribution of Working Group I to the Sixth Assessment Report of the Intergovernmental Panel on Climate Change [Masson-Delmotte, V., P. Zhai, A. Pirani, S.L. Connors, C. Péan, S. Berger, N. Caud, Y. Chen, L. Goldfarb, M.I. Gomis, M. Huang, K. Leitzell, E. Lonnoy, J.B.R. Matthews, T.K. Maycock, T. Waterfield, O. Yelekçi, R. Yu, and B. Zhou (eds.)]. Cambridge University Press, Cambridge, United Kingdom and New York, NY, USA, pp. 3−32, doi:10.1017/9781009157896.001.
- Appeaning Addo, K., Walkden, M. and Mills, J.P. (2008). Detection, measurement and prediction of shoreline recession in Accra, Ghana. ISPRS Journal of Photogrammetry and Remote Sensing, 63(5), pp.543–558. doi: https://doi.org/10.1016/j.isprsjprs.2008.04.001
Images and Videos
- Introductory video - Red Lemon, sourced from IStock
- Historical aerial photographies of Soulac-Sur-Mer (Signal building location): IGN - Photothèque Nationale - [1950-1965, 2011-2015] - https://remonterletemps.ign.fr/ We thank the Institut national de l'information géographique et forestière for making these images available.
- Xynthia storm passing through Spain and France: Meteosat IR108 infrared images (EUMETSAT images provided by NWCSAF/AEMET)
- Flooding in La Faute-sur-Mer: Andia, sourced from Alamy Stock Photo
- Demolition of the Le Signal building: Andia, sourced from Alamy Stock Photo
- Coastal erosion in Ghana: Ernest Ankomah Frimpong, sourced from Wikimedia commons
- Coastal photos in Calafell and Sant Pere Pescador (Catalonia): courtesy of the Impetus Project, https://climate-impetus.eu/
- Mechanical beach cleaning: KFP, sourced from Wikimedia commons
- Manual beach cleaning: PG Arphexad, sourced from Alamy Stock Photo
- Tidal area in The Wash, England: Steve Fareham
- Mudflats in The Wash, England: Stuart Aylmer, sourced from Alamy Stock Photo
- Soft cliffs in The Wash, England: geogphotos, sourced from Alamy Stock Photo
- Salt Marshes in Norfolk, England: Lisa Geoghegan, sourced from Alamy Stock Photo
- Vegetated dune in Lithuania: Nigel Hicks, sourced from Alamy Stock Photo